1. Introduction
High volumes of process water and different types of synthetic dyes such as basic, acid, reactive, direct, azo, mordant, dispersed, and sulfur are used during production in the textile industries, leather, cosmetics, paper printing, etc. [1–3]. Trace quantities of dyes reduce photo-synthetic activity and oxygen level for aquatic life due reducing light penetration into water. Acid and basic violet dyes are commonly used for dyeing of wool, silk, leather, paper, medicine, cosmetics, etc. [2, 4]. Due to their complex chemical structures and low biological degradability in water, these dyes are toxic and carcinogenic for human health and ecological systems. Different pollution control technologies were developed for the decolorizing of complex dyes including physical (adsorption, filtration, ion exchange, etc.), chemical (coagulation/flocculation, precipitation, oxidation, electrochemical, etc.), and biological (biosorption, aerobic, anaerobic) processes [2–7]. However, advanced oxidation processes (AOPs) such as ozonation, Fenton-reagent, photo-Fenton, electrochemical oxidation, ultraviolet radiation, ultrasound, etc. are favorable and effective options to oxidize organic pollutants and dyes in wastewater using strong oxidants, i.e. hydroxyl radicals and sulfate radicals [8].
Adsorption is an effective, easy to handle, and economic process for dye removal [9–12]. Adsorbents such as active carbon, agricultural waste, bentonite, chitosan, clay, fly ash (FA), sewage sludge, walnut shells, and zeolite are preferred due to their low cost and efficiency for adsorption treatment [13–24]. Activated carbon is the most popular adsorbent and is preferred to remove pollutants, i.e. dyes, metals, organics, etc. from water due to its high degree of microporosity and surface area [25–27]. Because of high cost production and regeneration of activated carbon, there is growing interest in using low-cost adsorbents [28]. In recent years, the utilization of coal to generate electricity is increasing and low-cost waste material such as FA is produced as a by-product of coal from thermal power plants [22]. Additionally, the increase in thermal power plants in Canakkale has yielded environmental problems and economic burdens with regards to FA storage [29]. Fly ash is an effective adsorbent thanks to the oxide forms such as SiO2, Al2O3, Fe2O3, and CaO in its structure and is used to remove various types of recalcitrant organic compounds (heavy metals, dyes, etc.) [29–33].
During the reaction, the adsorption capacity of FA decreases because dye is adsorbed and covers its surface [13]. The activation of the FA surface is ensured by using chemical [34], sonochemical [35], heat [36], hydrothermal [37], and ultrasound (US) treatments [13, 38]. Chemical treatment is commonly used to increase the adsorption of dye complexes. Wang et al [39] showed that treated and non-treated FA could be used for adsorption of basic dye and methylene blue in aqueous solutions. Adsorption capacity for non-treated FA was found to be 1.4 × 10⁻⁵ mol/g, while treated FA was determined as 2.4 × 10⁻⁵ mol/g.
In order to minimize the use of acid and base in the chemical activation process, the US process has been preferred recently. Ultrasound works according to the principal of cavitation linked to the formation, growth, and subsequent explosion of cavitation bubbles and acoustic waves in water by using US irradiation and promotes the surface porosity of the adsorbent and mass transfer rates at liquid/solid interfaces [40–44]. Different US frequencies such as low frequency (mechanical) and high frequency (radical) are used [45–47]. The mechanical energy of cavitation bubbles at higher US frequencies is less, but there are higher amounts of free radicals [47]. Due to ultrasonic chemical and physical effects, the shear forces from the decomposition of oxygen and water molecules by bubble collapse at high pressure (in the range of 500–5000 bar) and temperature (in the range of 1000–15,000 K) during the sonolysis of water induces the formation of free hydroxyl radicals (•OH, •HO2) and produces hydrogen peroxide (H2O2) as in the reactions given below [40, 45]:
Ultrasound cavitation has been used recently in order to change the physical surface properties of adsorbents and with the aim of decreasing the particle size and increasing the surface area, and thus adsorption capacity [13, 43]. In particular, sono-assisted adsorption using various adsorbents such as active carbon, clay, peanut husk powder, agricultural waste, zeolite, fly ash etc. was shown to be effective for the removal of recalcitrant contaminants, especially synthetic dyes, compared to other conventional methods [5, 13, 42, 43, 48–50].
There are no studies that about sono-assisted adsorption techniques for degradation of acid violet 7 (AV7) and basic violet 10 (BV10) dye using FA without adding acid or base for activation reported in the literature. The objective of this study was to compare the AV7 and BV10 adsorption capacity using FA alone, US alone, and combined ultrasound and fly ash (US/FA) processes under various experimental parameters such as amount of fly ash dose, contact time, and initial dye concentration. The variation in mineralogical, chemical, and physical characteristics of FA activated by ultrasonic bath (40 kHz) were determined. Further, reusability studies were also carried out for the regeneration of spent FA for the adsorption of AV7 and BV10 dyes. All obtained results were used to evaluate adsorption isotherms and kinetic models.
2. Material and Methods
2.1. Preparation of Synthetic Dye Solution
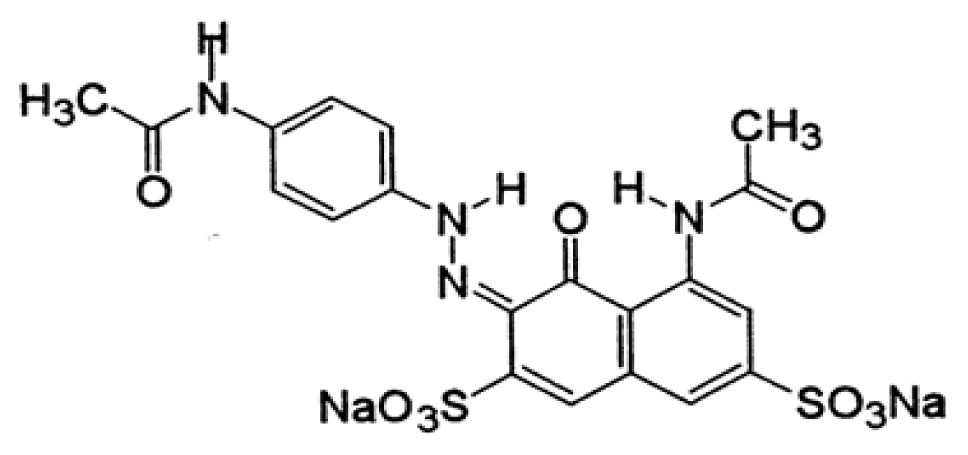
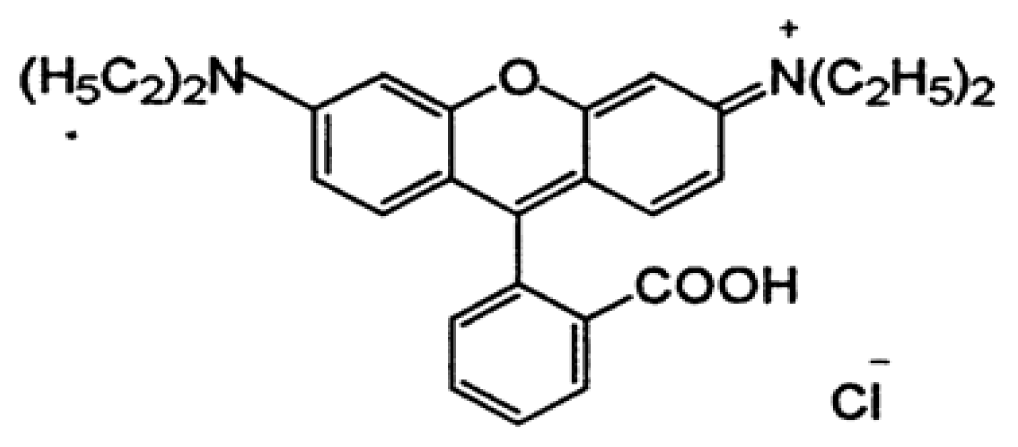
Acid violet 7 and BV10 chemicals were used for preparation of synthetic dye solution in this study (Sigma Aldrich, Missouri, USA). The dye stock solution dissolved 100 mg of AV7 and BV10 in 1 L deionized water. Ultrapure water (18.2 MΩ cm, 25°C) was prepared using a Milli-Q system in the laboratory. All chemicals were analytical grade reagents. The main properties of AV7 and BV10 are given in Table 1.
2.2. Experimental Procedure for Degradation of AV7 and BV10 using Fly Ash under Ultrasonic Irradiation
Batch adsorption and sono-assisted adsorption experiments for removal of AV7 and BV10 were carried out using FA alone, US alone, and combined US/FA by adjusting various experimental parameters such as dose (0.5 to 10 g), contact time (10 to 120 min), and initial dye concentration (25 to 100 mg L−1). Three control experiments were performed with the absence (FA alone) and presence of US, as well the combined US/FA process. The first set was conducted to determine the adsorption of AV7 and BV10 using FA alone under various experimental conditions using an orbital shaker for 2 h. The second set was used to determine the effect of US alone for AV7 and BV10 removal. Sono-assisted adsorption was carried out using an ultrasonic bath with a nominal power of 120 W and a frequency of 40 kHz with tank dimensions of 365 mm × 175 mm × 285 mm (Isolab, Eschau, Germany) (Fig. 1). The specific acoustic power was determined with the calorimetric method [41]. An Erlenmeyer flask containing dye solution was immersed in an ultrasonic bath operating at a US frequency of 40 kHz for various contact times and initial dye concentrations. A water-cooling-circulating unit was used to control the water temperature in the ultrasonic bath. The third set was conducted to remove AV7 and BV10 using combined US/FA. One hundred mL of AV7 and BV10 dye solutions that contained FA (0.5 to 10 g) were sonicated using a US bath under various experimental conditions. No acid or base was added into the aqueous solution during the reaction. The aqueous samples were withdrawn at various time intervals, and filtered using a 0.45 μm membrane filter (Millipore Co., Burlington, Massachusetts, USA). The concentration of residual AV7 and BV10 was analyzed using an ultraviolet-visible (UV-Vis) spectrophotometer (Hach, Colorado, USA) at maximum wavelengths (λmax) of 520 and 510 nm, respectively. Calibration curves were plotted between absorbance and concentration of the AV7 and BV10 solutions. All experiments were performed in triplicate.
The amount of dye adsorbed per unit weight of FA at equilibrium (qe, mg g−1) was obtained from:
where qe is the amount of dye uptake at equilibrium (mg g−1), C0 is the initial dye concentration (mg L−1), Ce is the dye concentration in the solution at equilibrium (mg L−1), V is the volume of the solution (L), and m is the mass of dry adsorbent (g).
The percentage removal efficiency (R) was calculated from:
2.3. Physical, Morphological, and Mineralogical Characterization of Fly Ash
Fly ash was supplied from a thermal power plant in northwestern Turkey. The pH of the FA was measured using a pH meter after mixing FA:deionized water (1:2 ratio) at the end of 12 h (WTW, Weilheim, Germany). The distribution of FA particle size (μm) was identified using Mastersizer 3000 Hydro (Malvern Panalytical, England) in the Polymer Laboratory of the Chemistry Department in Canakkale Onsekiz Mart University. The specific surface area (m2 g−1) of FA was purified by degassing under vacuum conditions and determined by Brunauer-Emmett-Teller (BET) model, based on the adsorption of a monomolecular layer of liquid nitrogen on the surface of the FA (Quadrasorb SI, USA). The qualitative assessment and morphology of FA was identified using micro-graphs taken with a scanning electron microscope (SEM) with energy dispersive X-ray spectroscopy (EDX) (JEOL JSM-7100F, Tokyo, Japan) at the Centre for Material Science in Canakkale Onsekiz Mart University. The mineral components of FA were defined for 5–75° 2Θ with Cu-Kα radiation (40 kV and 20 mA) using X-ray powder diffraction (XRD) (Malvern Panalytical). The elemental compositions of FA were measured using an X-ray fluorescence spectrometer (XRF) (ARL ADVANT’X, Massachusetts, USA) in the thermal power plant laboratory.
2.4. Data Analysis
Adsorption isotherms describe the adsorption mechanism between the interaction of equilibrium adsorbate concentration and amount of adsorbate adsorbed in aqueous solution on the adsorbent surface [51, 52]. The adsorption isotherm tests were conducted by agitating AV7 and BV10 dye solutions with various initial AV7 and BV10 concentrations ranging from 25 to 100 mg L−1 considering optimum dose and contact time for FA and the combined US/FA process. The Langmuir and Freundlich isotherms define the surface properties of the adsorbent as heterogeneous (multilayer) or homogeneous (monolayer). The Langmuir isotherm was calculated using Eq. (6) [53]:
where qm (mg g−1) is maximum adsorption capacity and b (L mg−1) is the Langmuir constant. The qm and b values were determined from plots of Ce/qe versus Ce.
The Freundlich isotherm represents adsorption on a heterogeneous adsorbent surface by multilayer sorption and is expressed in Eq. (7) [54]:
where Freundlich constants are represented as Kf and n which correlate with adsorption capacity and intensity of the FA. The values of Kf and n were calculated from the plot of ln Ce versus ln qe.
The adsorption kinetics were described using Lagergren’s pseudo-first [55], second order [56], and intraparticle diffusion [57] models to characterize the adsorption mechanisms of AV7 and BV10 dyes from aqueous solution. The adsorption kinetics were examined with various contact times for FA and combined US/FA processes considering optimum experimental conditions. The qe and k1 values were determined from plots of ln (qe-qt) versus t for the pseudo-first order model. The qe and k2 values were determined from plots of t/qt versus t for the pseudo-second order model. The kid value was determined from plots of qt versus t1/2 for the intraparticle diffusion model.
where k1 (min−1), k2 (g mg−1 min−1), and kid (mg g−1 min−1/2) are the pseudo-first-order, pseudo-second-order and intraparticle diffusion kinetic model rate constants, respectively.
2.5. Regeneration and Reuse of Spent Fly Ash
Regeneration is important for recovery and reuse of solid matter from aqueous solutions and to decrease the sludge volume after the reaction. The regeneration and reuse experiments for FA and combined US/FA were investigated over six consecutive cycles. In the first set, FA particles reacted with 100 mL of AV7 and BV10 solutions under optimum experimental conditions for adsorption (FA) and sono-assisted adsorption (US/FA) processes. The solid residue (SR) of FA:AV7 and FA:BV10 for FA and combined US/FA processes were separated using a filtration system and rinsed using deionized water. The recovered SR after FA and combined US/FA processes were re-reacted with 100 mL of AV7 and BV10 synthetic dye solutions. The regeneration and reuse experiments of spent FA were continued until the initial dye concentration (50 mg L−1) was reached. The remaining AV7 and BV10 concentrations in the leachate phase were analyzed by UV-Vis spectrophotometer. Each adsorption experiment was repeated in triplicate.
3. Results and Discussion
3.1. Characterization of Fly Ash
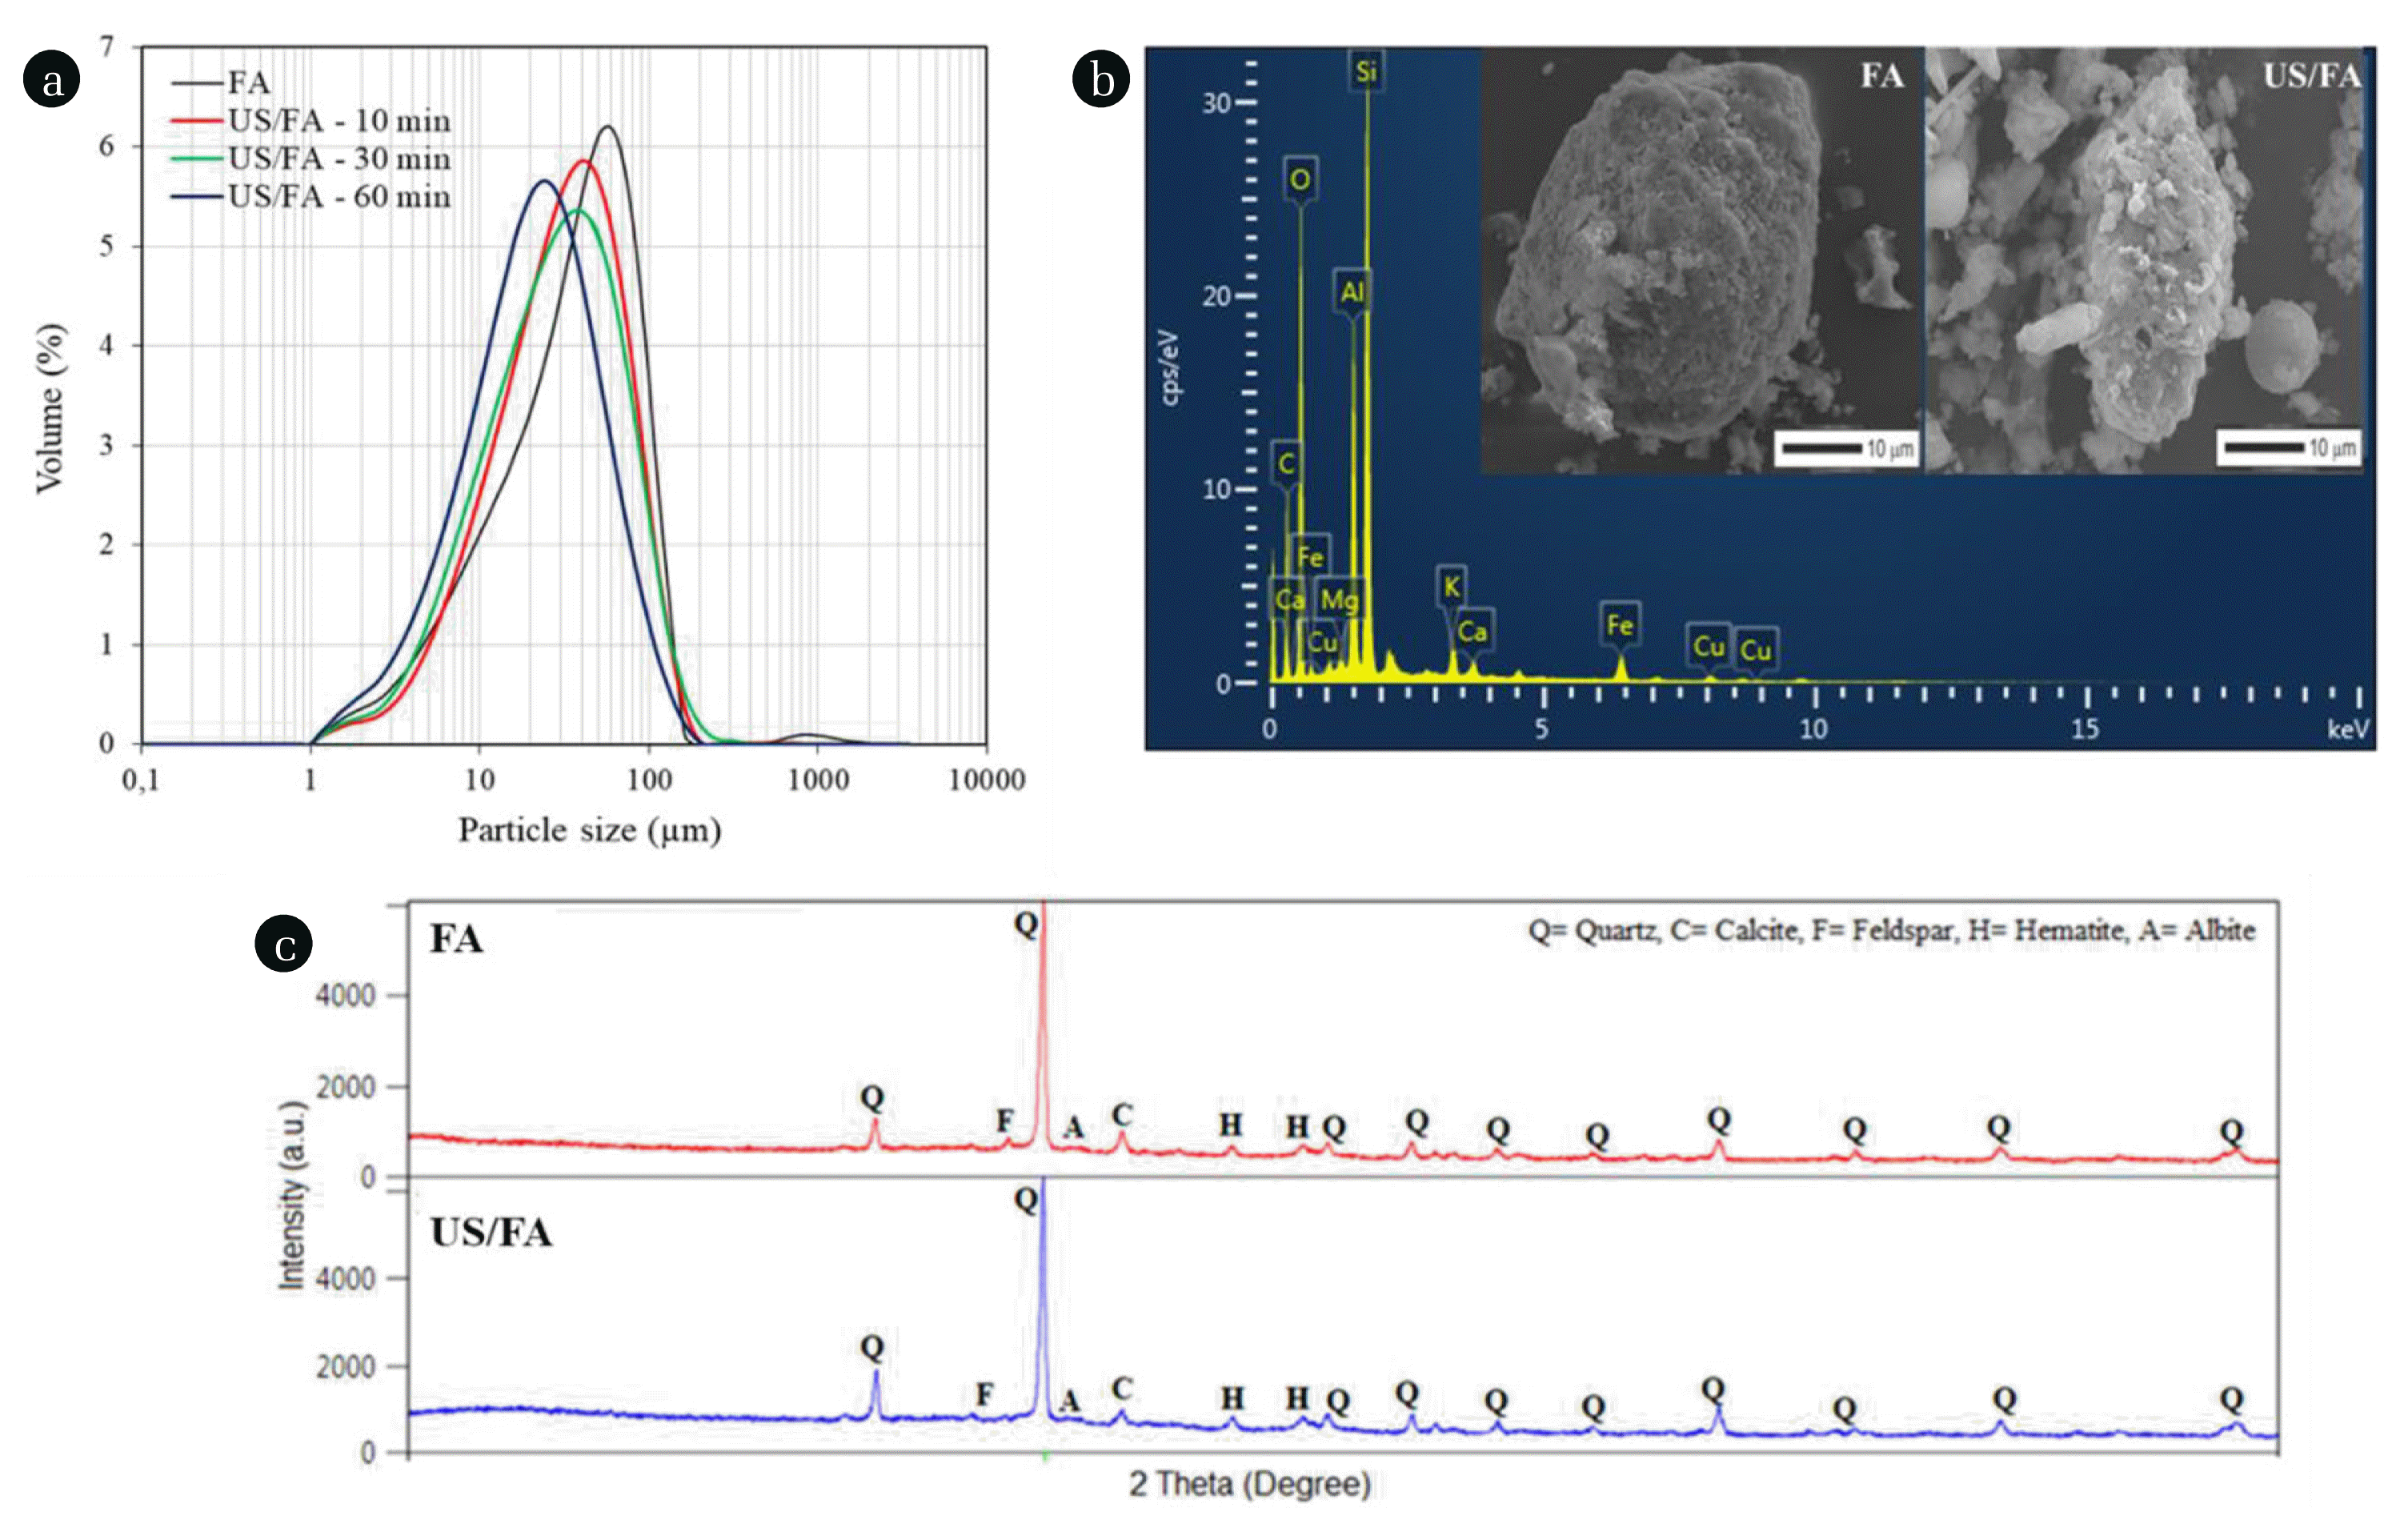
The pH of FA was alkaline and measured as 11.05. As shown in Fig. 2(a), the distribution of FA particle size ranged between 1.28 μm and 163 μm. The average size (D50) of FA was 41.10 μm. In the presence of US, increased sonication time decreased the particle diameter of FA and so smaller particles were observed. It was observed that the particle size of FA decreased by increasing sonication time from 10 to 60 min at 40 kHz (Fig. 2(a)). The D50 of FA activated at 40 kHz was 33.20 μm, 30.60 μm, and 22.50 μm for 10, 30, and 60 min, respectively. BET analysis showed that the specific surface area of raw FA was obtained as 3.24 m2 g−1, while the specific surface area of FA increased to 5.10 m2 g−1 after reactions in water using the combined US/FA process. XRF analysis showed that the raw FA was mainly composed of high amounts of silica, alumina, and iron oxide and was in Class F according to American Society for Testing and Materials [58]. The SEM images in Fig. 2(b) showed that the FA surface was porous with random distribution of particles. Ultrasound cavitation and shockwave effects created fractures and cracks on the FA surface. According to the EDX analysis, the surface elemental composition mainly consisted of C, O, Si, Al, Fe, and K, while the trace elements were Mg, Ca, and Cu. The XRD pattern of FA particles for FA and US/FA comprised quartz, calcite, feldspar, hematite, and albite (Fig. 2(c)). The XRD analysis indicated that US irradiation did not change the crystal structure of raw FA.
3.2. Effect of Fly Ash Dose
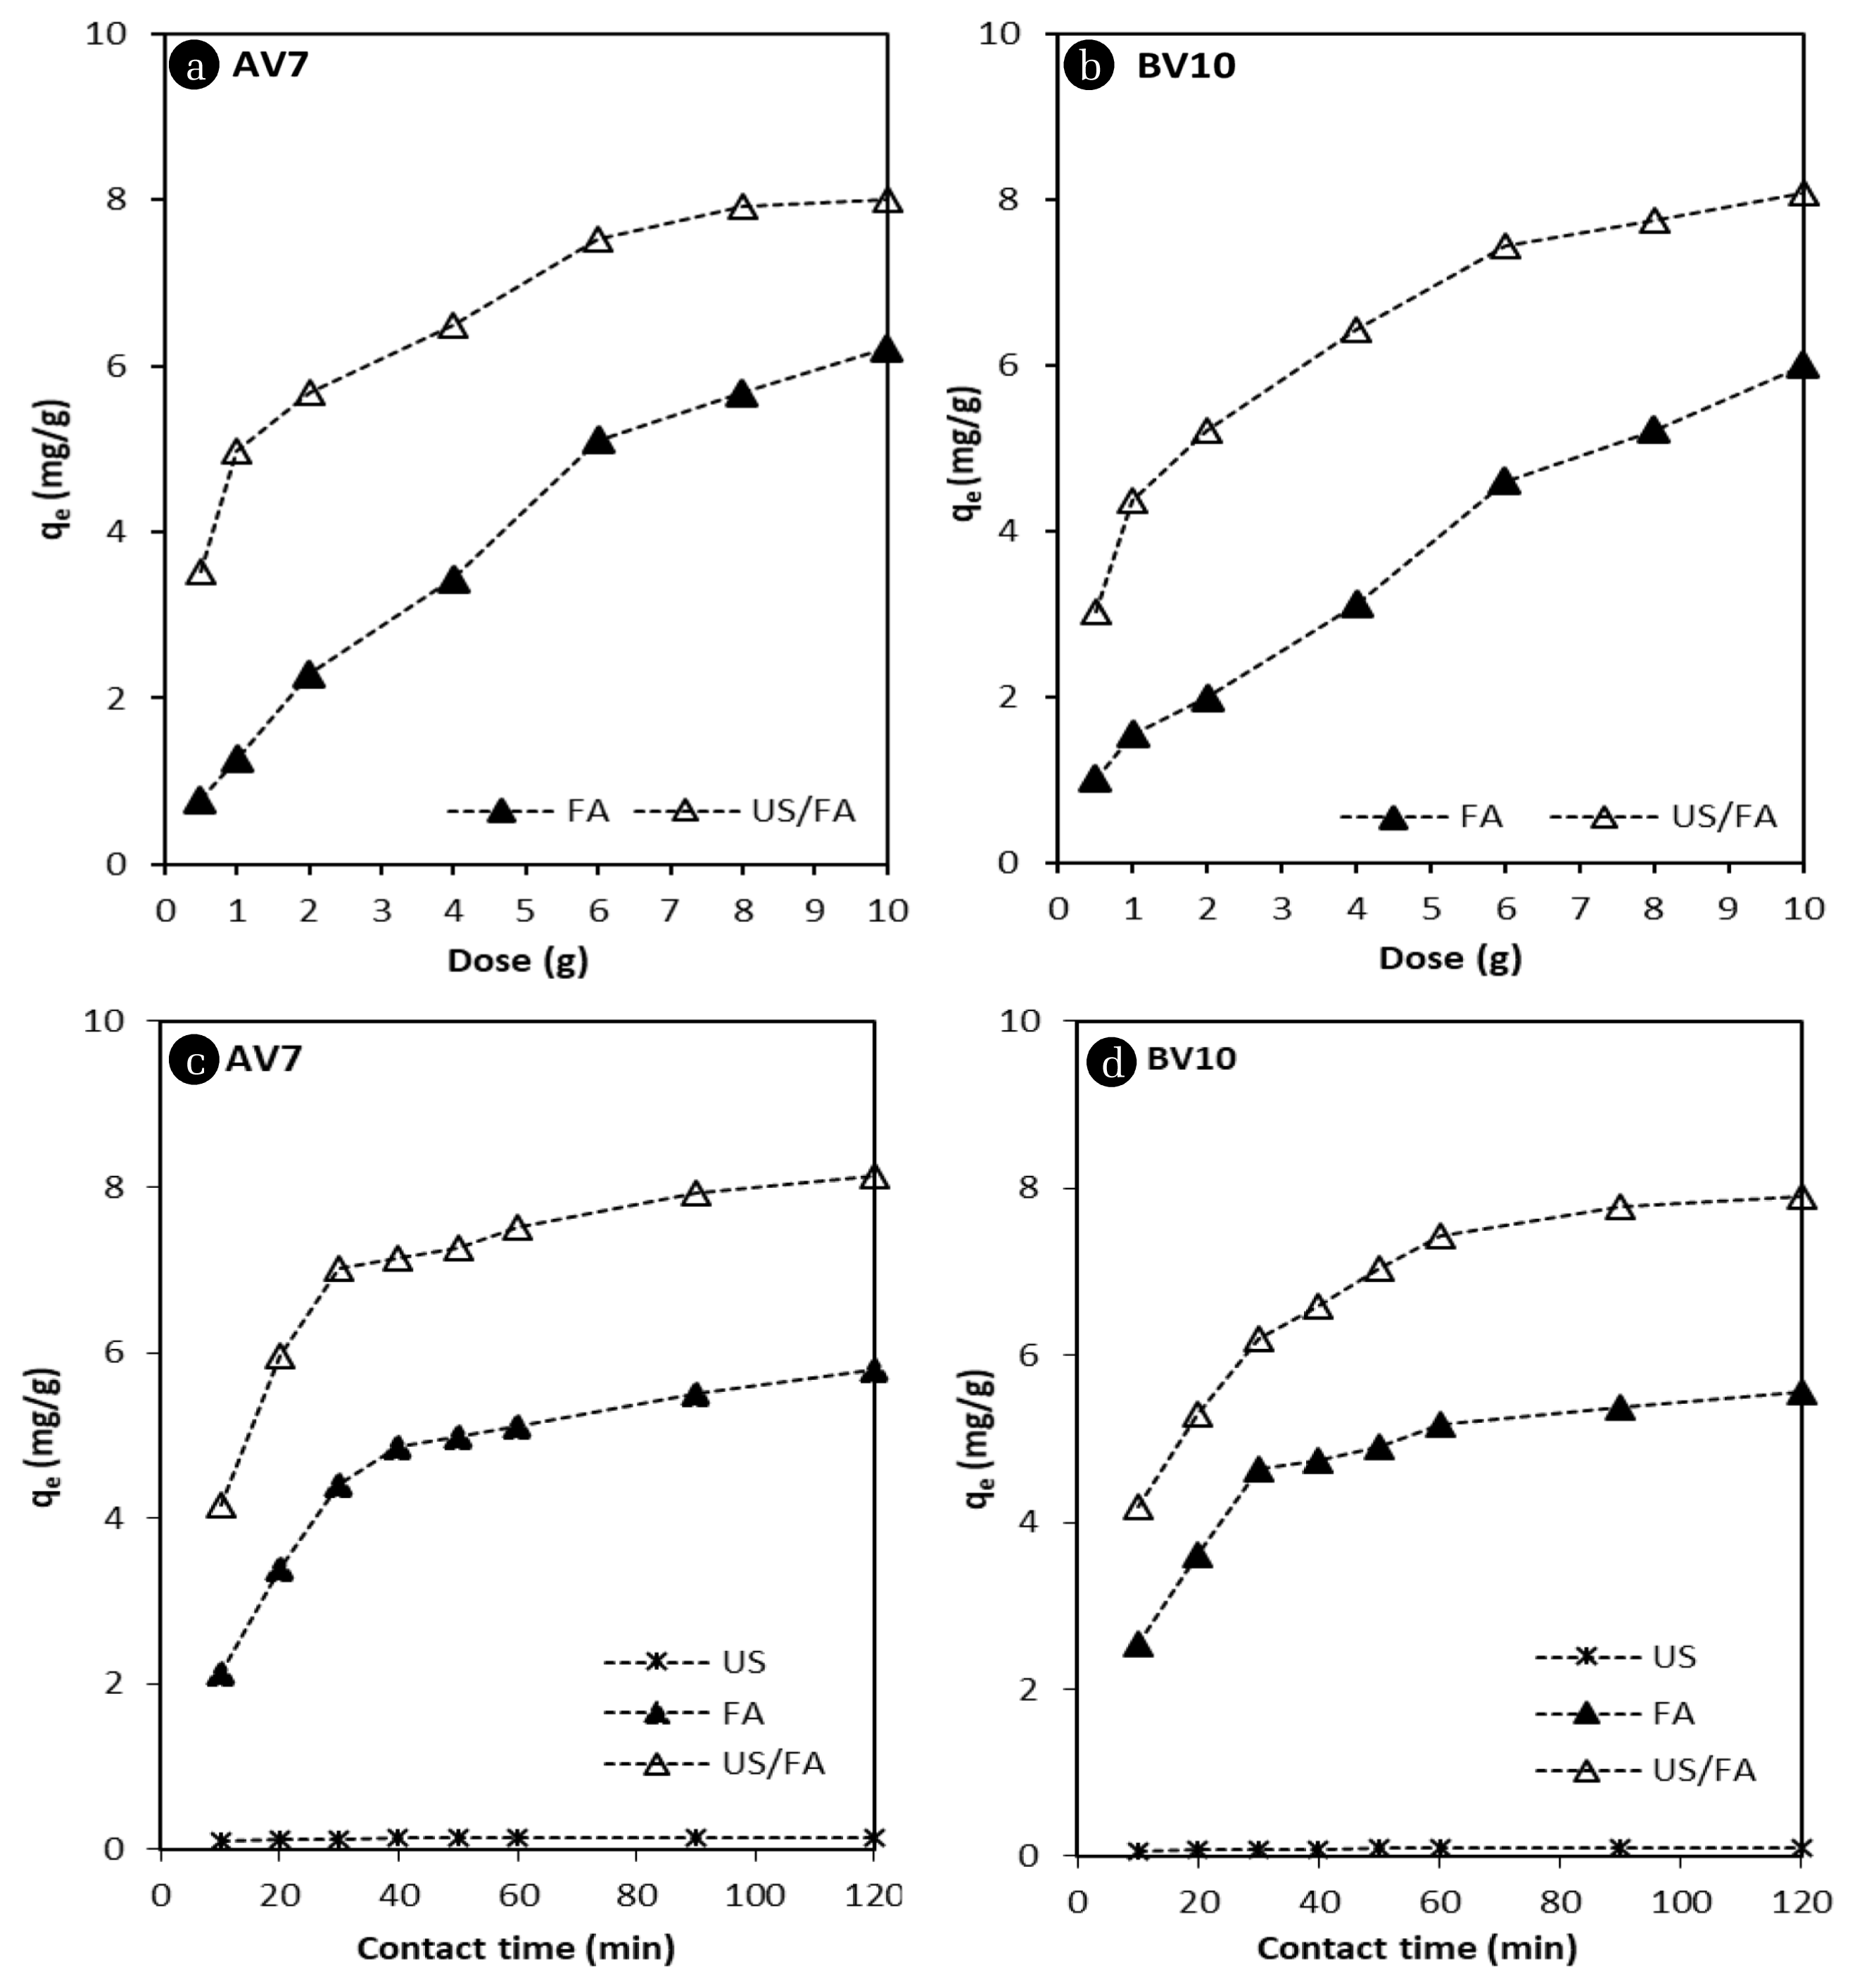
The amount of adsorbent is an effective parameter for increasing adsorption capacity. To explore the effect of dose on the adsorption and sono-adsorption process of AV7 and BV10, experiments were conducted by varying the FA dose from 0.5 to 10 g for 60 min (Fig. 3(a)–(b)). The concentration of AV7 and BV10 in aqueous solution decreased with a high incremental trend until 6 g dose of FA due to the increase the adsorption surface area. As shown in Fig. 3(a), there was no big difference observed for the removal of AV7 and BV10 between 8 and 10 g FA dose. The adsorption capacities of FA alone for AV7 and BV10 were calculated as 5.10 and 5.16 mg g−1, respectively. As the FA dose increased, the amount of AV7 and BV10 dye adsorbed sharply increased by using combined US/FA compared with FA alone and the same results were obtained using lower doses. The ultrasound process was a useful tool to prevent surface passivation with mechanical forces and shock waves. The combined US/FA process enhanced the activation of the surface and the mass transfer of FA particle reactions in the solution [44, 48]. The 40 kHz ultrasonic bath produced bubbles with acoustic cavitation which increased surface area of FA, and thus AV7 and BV10 removal using combined US/FA was observed to be more effective compared with FA alone. Dye molecules covered the FA surface. So, adsorption dye capacity of FA decreased over time. The synergistic effect of sono-assisted adsorption was observed after the reaction. The ultrasound cavitation effect and •OH radicals produced by the 40 kHz frequency created the active surface area on FA [38]. The FA surface was always kept active by the effect of US mechanical forces. Thus, the US process positively contributed by increasing the FA adsorption capacity, and halving the FA dose for AV7 and BV10 removal. Similar results for AV7 and BV10 removal were obtained using approximately 2 g with combined US/FA, and 6 g with FA alone. BV10 removal provided better results than AV7 because BV10 is a cationic dye. As the pH increased, the FA surface became negatively charged under alkali conditions [13, 38], and the positively-charged BV10 dye was adsorbed by the negatively-charged FA surface; thus, the BV10 adsorption efficiency increased. qe values increased as the FA dose increased, and then remained nearly constant after 6 g FA dose. So, the optimum dose was selected as 6 g. Maximum adsorption capacity of combined US/FA of 7.43 and 7.51 mg g−1 was obtained for AV7 and BV10, respectively. The decolorization efficiency of AV7 and BV10 could reach 95%–99% for the combined US/FA process, while it only removed 4.1% using US alone and 50%–56% using FA alone within 60 minutes. Some investigations reported the adsorption of dyes was improved using combined US/FA with various adsorbents [59–62]. The degradation of AO7 under US irradiation was determined as 76.7 and 3.8% within 60 min using combined US/FA and US alone, respectively [61]. Another research reported that the adsorption capacity for basic dyes, methylene blue, crystal violet, and rhodamine B was improved using various FA samples treated via microwave, heating, and ultrasound [35]. Adsorption capacities of various adsorbents with the absence and presence of ultrasonic effect for different kinds of dyes are given in Table 2.
3.3. Effect of Contact Time
As the reaction time increases in the adsorption process, the diffusion rate between the adsorbent and dye increases. Acid violet 7 and BV10 aqueous solutions containing 6 g/100 mL of FA particles were treated in the absence and presence of US. As shown in Fig. 3(c)–(d), the batch experimental results revealed that US alone was ineffective for the removal of AV7 and BV10 from aqueous solution. The same result was observed by [49]. The concentration of AV7 and BV10 reduced significantly with an increase in contact time from 10 to 120 min using FA alone. It was observed that the amount of adsorbed AV7 and BV10 was unchanged as the desorbable surface decreased under equilibrium conditions. The adsorption activity of FA was very quick initially and the uptake of dye onto FA reached equilibrium in the first 60 min. The effect of contact time for removal of reactive red 23, reactive blue 171, acid black 1, and acid blue 193 dyes was investigated using 0.4 g of FA dose for acid dye and 2.0 g of FA dose for reactive dye for a period of 6 h. According to the obtained results, the adsorption of dyes increased in the first 20 min, then remained stable after 60 min of contact time [32]. With prolonged contact time, the number of active sites became less on the FA surface, and thus the adsorption slowed. Over 85% removal of AV7 and BV10 was observed using the combined US/FA process after 30 min. US irradiation provided improvements in the surface characteristics of FA and enhanced the uptake capacity for AV7 and BV10. Microstreaming, occurring during US cavitation, promoted mixing at the solid-liquid interfaces and maintained the mass transfer rate between FA and both dyes. The high adsorption efficiency in the initial stage was due to the abundant free adsorption sites on FA. Fly ash activation using US destroyed the oxide layer on the FA surface. So, the increased adsorption capacity of combined US/FA was ensured, which reduced the contact time. The contact time was halved by using combined US/FA for AV7 and BV10 removal compared with FA alone. The adsorption capacity of FA alone for AV7 and BV10 was found to be 5.10 and 5.16 mg g−1 at 60 min, respectively; while the adsorption capacity of combined US/FA for AV7 and BV10 was increased to 7.43 and 7.51 mg g−1 after sonication, respectively. The same results were proved by [13, 59]. Ileri [13] reported that the surface area of FA increased with US cavitation at 20 kHz and decreased contact time from 60 to 20 min for methyl red removal.
3.4. Effect of Initial Concentration of AV7 and BV10
The initial concentration plays an important role in increasing the mass transfer of ions between the solid and aqueous phases [10]. Dye uptake capacity with varying initial concentrations (25 to 100 mg L−1) of AV7 and BV10 are given in Fig. S1. With increased initial AV7 and BV10 concentration (from 25 to 100 mg L−1), dye uptake capacity increased. The AV7 and BV10 adsorption increased, and then almost reached equilibrium at 75 mg L−1 and 100 mg L−1 concentration using FA alone. It was determined that US alone was ineffective for AV7 and BV10 removal. The adsorption efficiency of combined US/FA increased with the incremental initial concentration of AV7 and BV10 due to the increase in the number of ions competing for the available binding sites and driving force of mass transfer on the surface of FA [13, 32]. Increased initial dye concentration (from 25 to 100 mg L−1) decreased mass transfer at the bubble-liquid interface, it enhanced competition for the •OH radicals between dye molecules, and thus it reduced the ultrasonic dye degradation due to the presence of dye molecules at the bubble interface. Increasing the initial AV7 and BV10 concentrations (from 25 to 100 mg L−1), the dye uptake capacity was elevated from 3.91 to 12.04 mg g−1 and from 4.10 to 11.74 mg g−1 using combined US/FA, respectively. It was observed that the US/FA process was more effective for AV7 and BV10 removal at a specific range of initial concentration compared with US and FA alone due to the increase in surface area and mass transfer rate of FA particles with the effect of ultrasonic cavitation.
3.5. Adsorption Isotherm
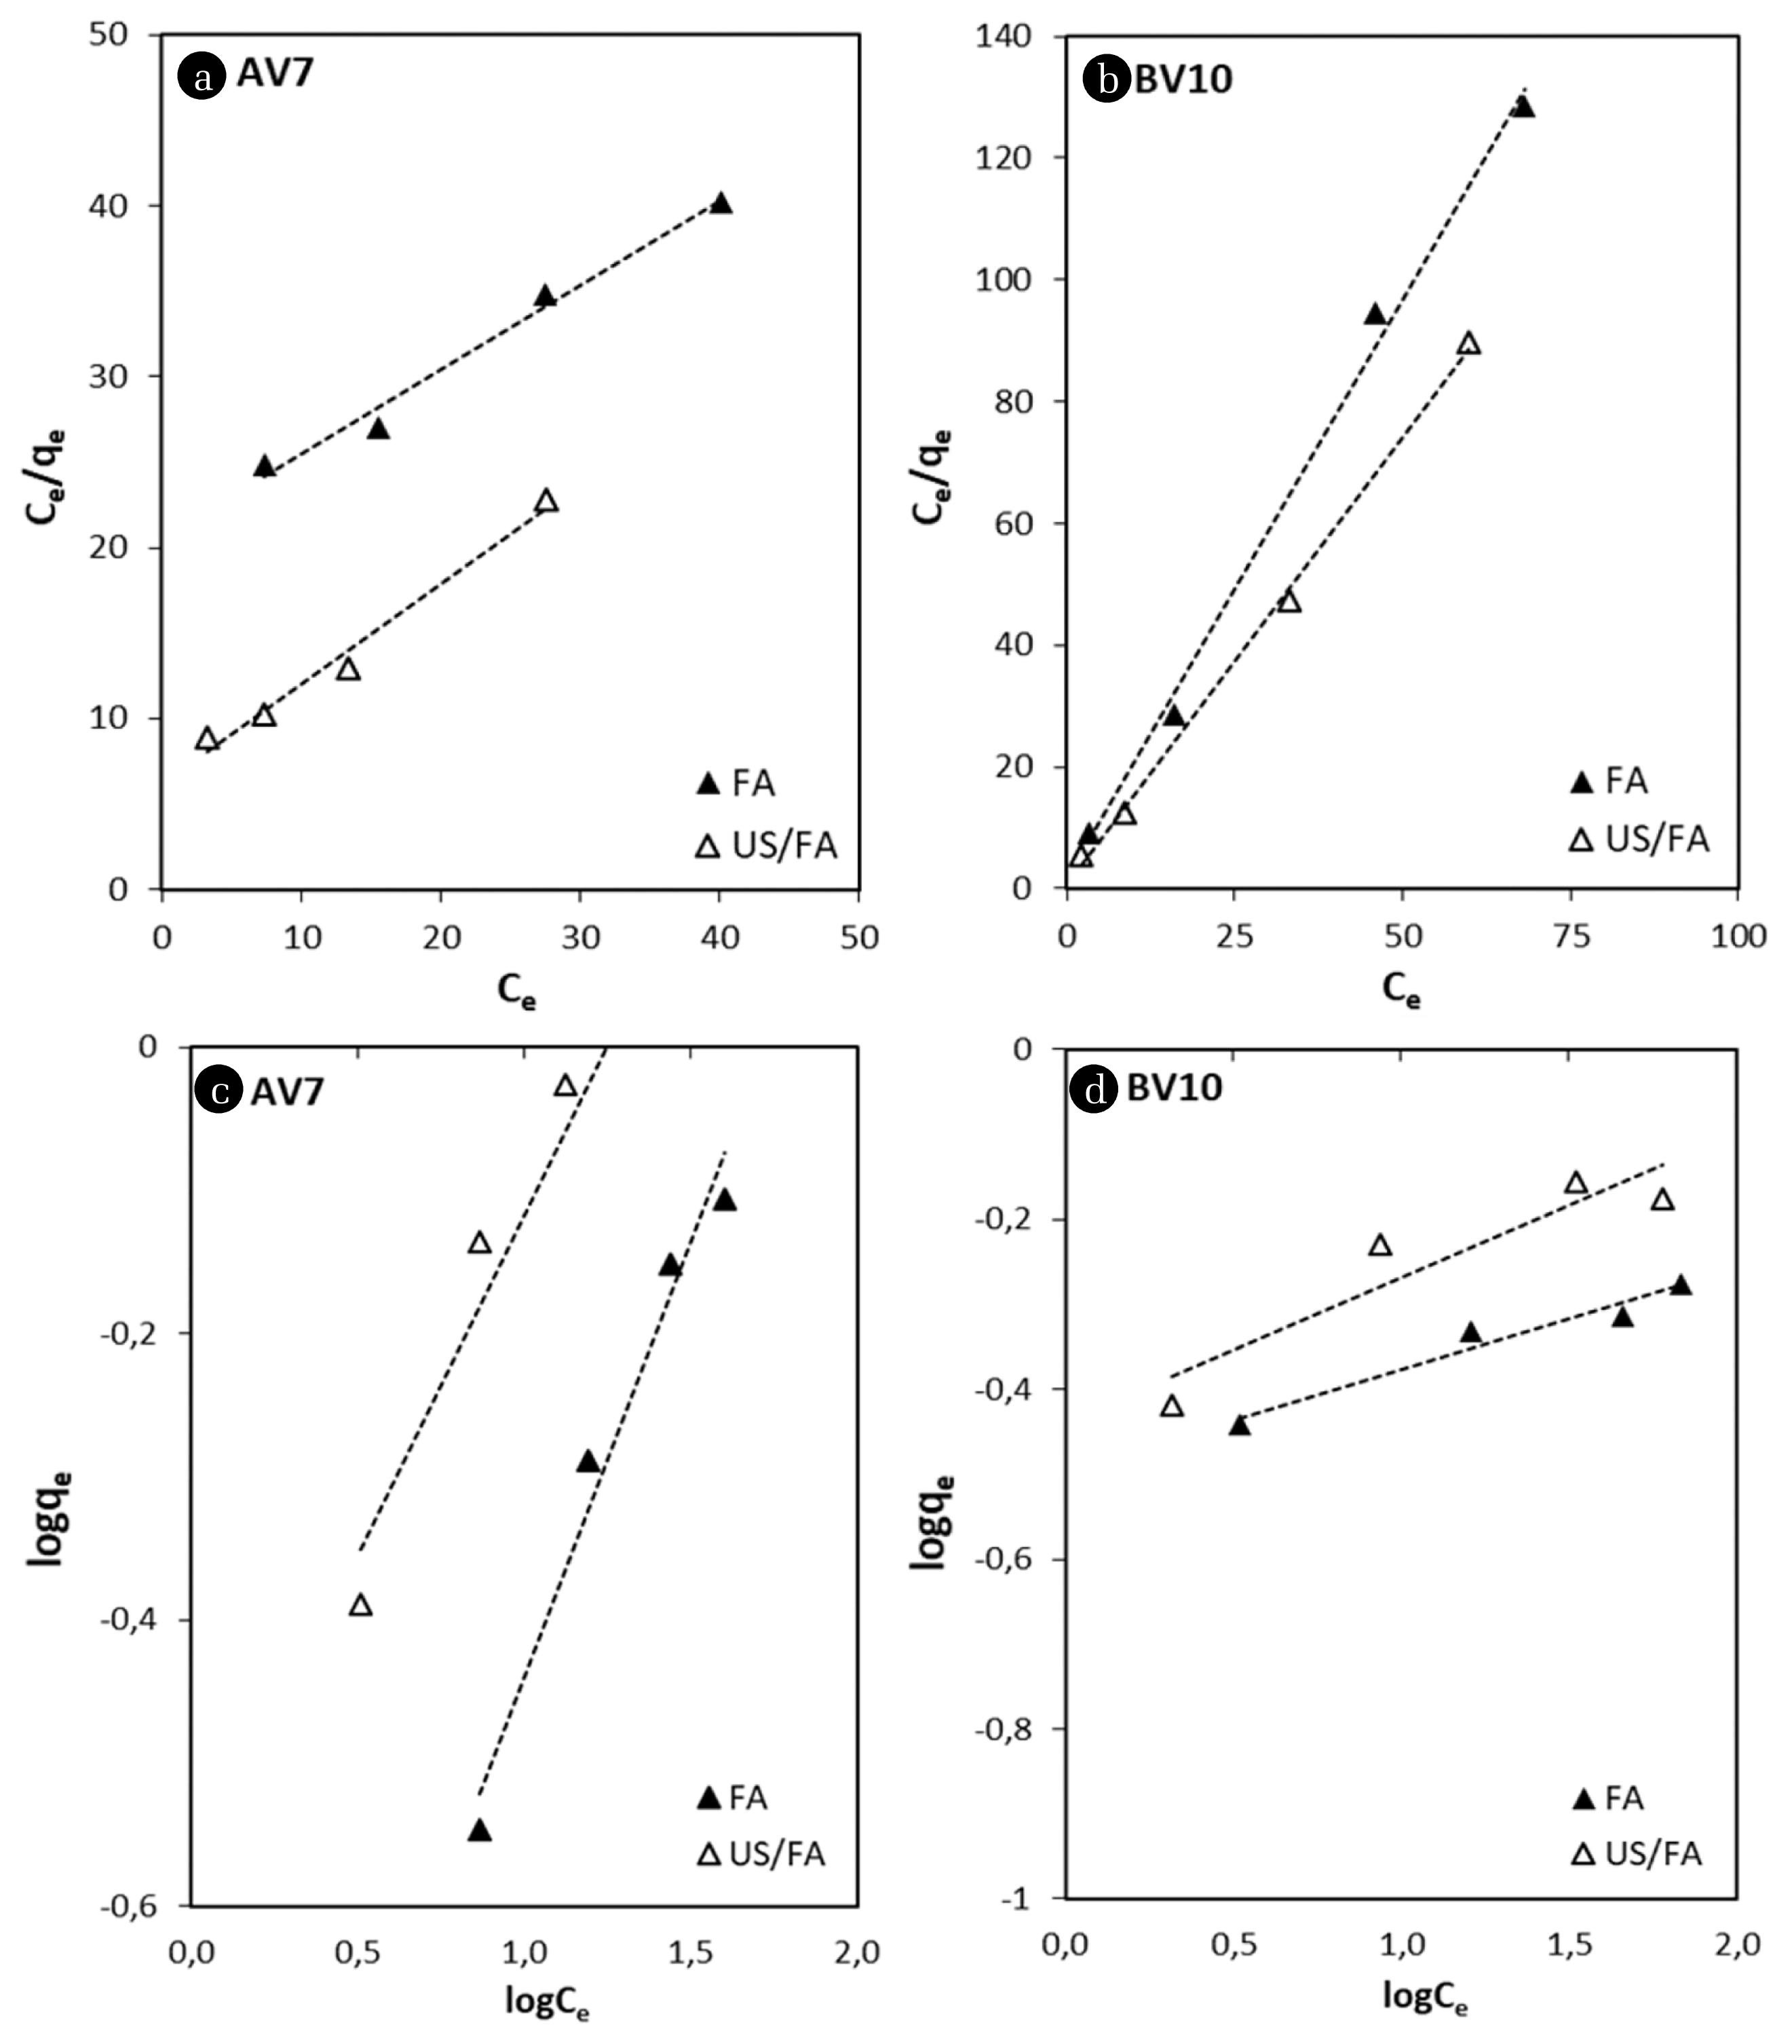
The Langmuir and Freundlich isotherms were applied to determine the amount of dye adsorbed under varying initial concentrations (25, 50, 75 and 100 mg L−1) using Eq. (6) and (7). The Langmuir isotherm parameters, b and qm, were calculated from the intercepts and slopes of the straight lines on plots of Ce/qe versus Ce (Fig. 4(a)–(b)) [53], while the Freundlich isotherm constants, Kf and 1/n were computed from the plot of ln Ce versus ln qe (Fig. 4(c)–(d)) [54]. The calculated constant values and correlation coefficients (R2) are presented in Table S1. The Langmuir model was found to be best fit adsorption model, which reflected its suitability for describing the adsorption data. The Langmuir isotherm equation fitted the experimental data better (R2 > 0.98) than the Freundlich isotherm equation (R2 > 0.87). The value of RL being in the range 0–1 indicated favorable adsorption of AV7 and BV10 onto FA alone and combined US/FA. Also, lower RL values at higher initial AV7 and BV10 concentrations proved that adsorption was more favorable at higher initial concentration. The values of n > 1 represent favorable adsorption conditions.
3.6. Adsorption Kinetics
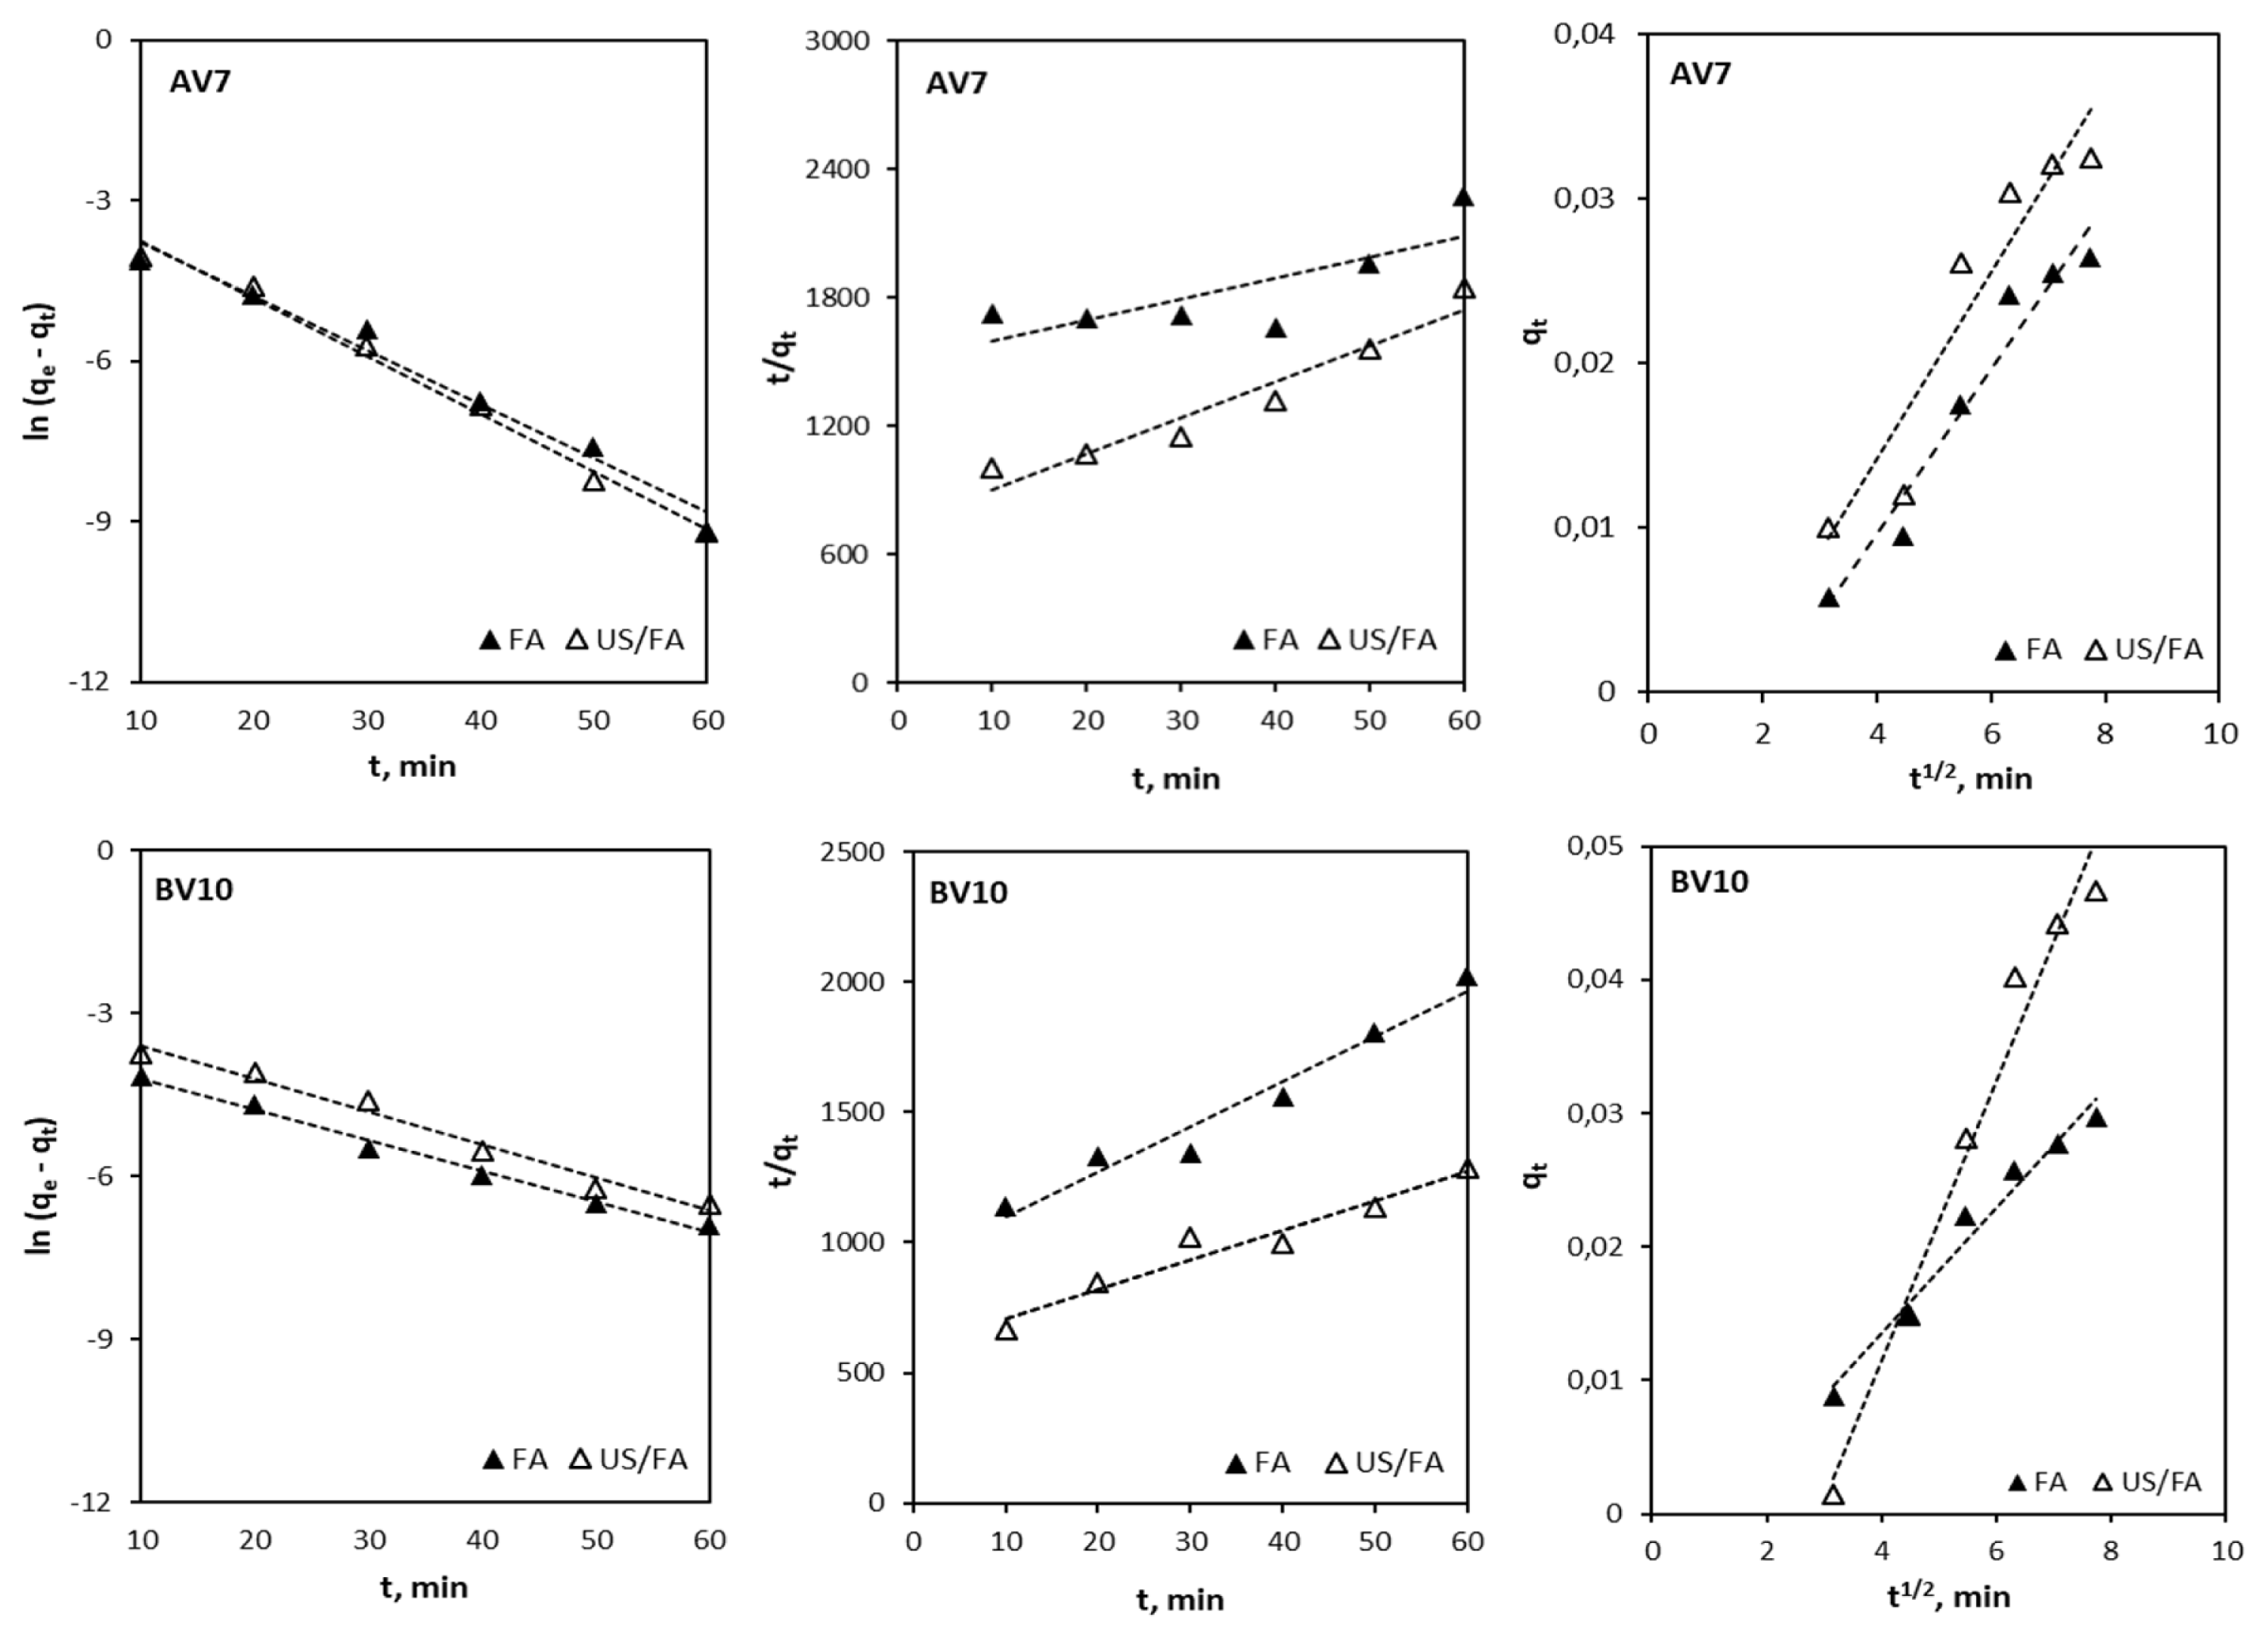
Adsorption kinetics are used to determine the adsorption characteristics and mechanism between the adsorbate and adsorbent [62–64]. Acid violet 7 and BV10 adsorption kinetics using FA alone and combined US/FA were investigated with different contact times and the results are illustrated in Fig. 5. The values of k1 and qe were computed from the plot of ln (qe-qt) versus t (Table S2). Lagergren’s pseudo-first order kinetic model for adsorption of AV7 and BV10 onto FA and combined US/FA was more applicable due to high correlation coefficients (R2 >0.98) and (R2 > 0.97), respectively. The apparent pseudo-first order kinetics fit the two processes well and the k1 for FA alone and combined US/FA were calculated as 0.10 and 0.10 min−1 for AV7 and 0.05 and 0.06 min−1 for BV10, respectively. The qe and k2 values were determined from the slope and intercept of the plots of t/qt versus t, respectively. As presented in Table S2, the R2 obtained for the pseudo-second order model was determined to be lower than for the pseudo-first order model (R2 = 0.73 to 0.94). The adsorption mechanism was also tested to identify whether it abided by the intraparticle diffusion model. The kid was calculated from the slope of the linear plot (qt versus t1/2). The regression of the intraparticle diffusion model was not linear and it is not a rate-controlling step for adsorption of AV7 and BV10. According to the obtained adsorption kinetics results, the pseudo-first order kinetic model was found to be more suitable for AV7 and BV10 adsorption onto FA, as most of the R2 values exceeded 0.97.
3.7. Regeneration and Reuse of Spent Fly Ash
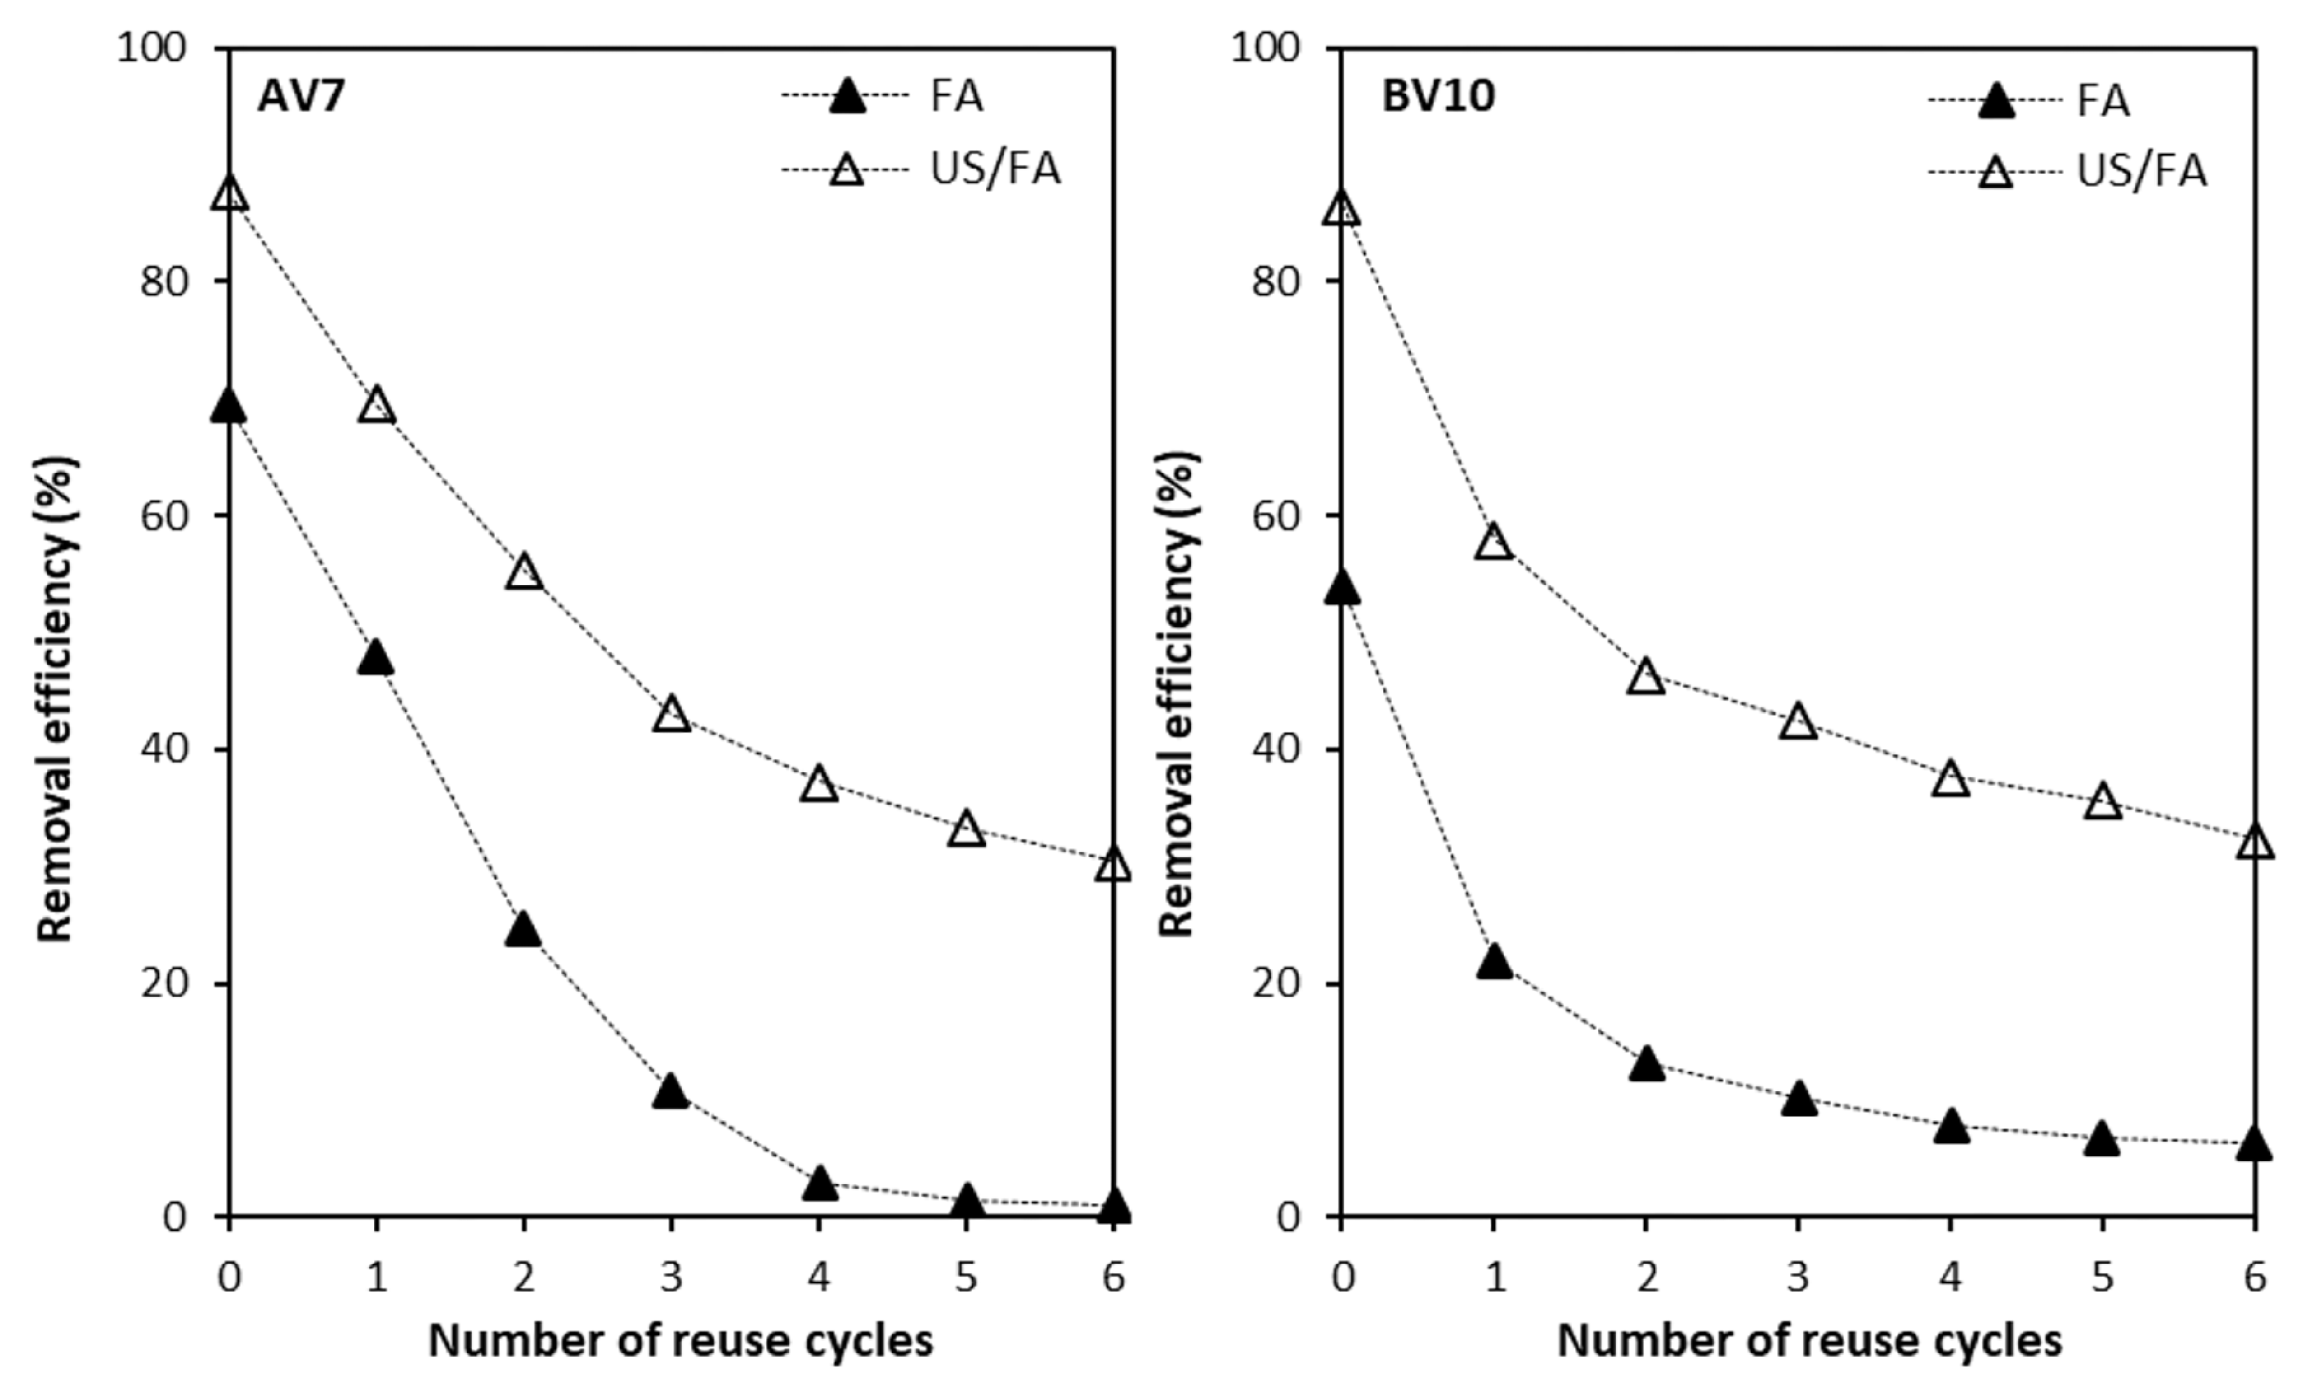
With the aim of reducing waste sludge volume, the reusability of FA was investigated to evaluate the reuse of the adsorbent for AV7 and BV10 removal. The reusability experiments for FA and combined US/FA processes were conducted by using six consecutive cycles. During reusability experiments, FA was not exposed or rinsed with acid or base chemicals. Firstly, the ash particles for FA alone and combined US/FA processes were reacted with 100 mL of AV7 and BV10 solution keeping all the parameters constant (mass of FA: 4 g/100 mL, contact time: 30 min, dye concentration: 50 mg L−1). After the reaction, the SR was separated by filtration, and re-reacted with 100 mL of AV7 and BV10 solution for FA alone and combined US/FA process. The concentrations of AV7 and BV10 in the leachate were measured using a spectrophotometer. It was observed that the FA particles continued to be reactive in the first cycle, and the uptake of AV7 continued to decrease compared with BV10 and remained constant after the second cycle (Fig. 6). As the number of cycles increased, the removal efficiency for AV7 by FA alone and combined US/FA decreased from 69 to 2%, and from 90 to 30%, respectively. The removal efficiency for BV10 decreased from 54 to 7% and 87 to 32% using FA alone and combined US/FA, respectively, as cycle numbers increased to six consecutive cycles. At the end of each regeneration experiment, it was determined that the FA surface was covered with dye ions, and as the number of recovery events increased, the available active sites on FA reduced. At the end of the third cycle, the dye concentration remained fixed. With the US effect which increased the surface area of FA, it was determined that the combined US/FA process activity maintained the dye adsorption capacity. With the effect of cavitation and mechanical forces, the combined US/FA process had higher removal efficiency for AV7 and BV10 compared to FA alone. It was detected that the reusability of SRs for AV7 and BV10 removal was proven for two and four consecutive cycles using FA alone and combined US/FA process, respectively. The increase in the number of cycles led to decreases in the removal percentage of AV7 and BV10. After four consecutive cycles, the removal percentages of AV7 and BV10 were identified to remain constant. It was demonstrated by [50] that the regeneration experiment was carried out for all the synthesized low-cost reusable nano zeolite adsorbents (CFA, nFAZX, and CZX) and preserved their performance for up to 5 cycles (55.20, 93.40 and 88.90%).
4. Conclusions
The adsorption and sono-assisted adsorption performance of FA particles was investigated for AV7 and BV10 removal in aqueous solutions under various experimental conditions. Thanks to this study, use of FA generated as secondary waste product of coal utilizing energy plants minimized solid waste volume. FA was activated with the US process without any chemical addition, and the surface area of FA was increased and more AV7 and BV10 removal was achieved. The US process when used alone was ineffective for AV7 and BV10 removal from aqueous solutions. The combined US/FA process played an important role for AV7 and BV10 removal. The sono-assisted adsorption efficiency was enhanced markedly when FA particles were exposed to US cavitation effects. The application of US was proven to be effective in reducing the particle size, and increasing the adsorption capacity and surface area of FA. The results clearly indicate that the efficiency of the US bath at 40 kHz increased as the •OH radical production increased. The dye uptake capacities for AV7 and BV10 were 5.10 and 5.16 mg g−1 using FA alone, respectively, while they increased to 7.43 and 7.51 mg g−1 using combined US/FA with FA dose 6 g/100 mL within 60 min. Depending on the increasing initial concentration of AV7 and BV10, dye adsorption capacity increased, too. Regeneration and reuse of FA particles for AV7 and BV10 removal was viable for four consecutive cycles using the combined US/FA process and for two consecutive cycles using FA alone.


