1. Introduction
There is an increasing demand for alternative liquid fuels due to a shortage of fossil fuels, environmental pollution, and large greenhouse gas emissions. Many biomass conversion methods such as pyrolysis, transesterification, and hydrothermal liquefaction have been developed to produce alternative liquid fuels [1]. Municipal wastewater treatment plants in the USA produce over 6.2 million tons of dried sewage sludge every year [2]; the annual production of sewage sludge in Korea was 4 million tons in 2013, and is expected to increase to 5.4 million tons in 2025 [3]. The disposal of sewage sludge in Korea, highly populated and has suffered from limited landfill sites, was previously heavily dependent on ocean dumping (61.6% of the total sewage sludge generated in 2011). However, this was prohibited after 2012 by the London Convention ’96 protocol [4]. Nowadays, the most common processes for disposal of sludge include landfilling, agricultural application, and incineration [5]. The above processes are becoming increasingly difficult to operate, because of land-related limitations and increased restrictive regulations [5]. Therefore, other processes that are more economical and respectful of the environment need to be developed. Alternatively, a novel process that converts sewage sludge to valuable chemicals with minimizing final waste would be a promising solution in the treatment of sewage sludge.
Sewage sludge consists of proteins, carbohydrates, and lipids [6], which can be converted to fuels such as biodiesel [2, 6], bioethanol, and bio-oil [5–8] by transesterification, fermentation, and pyrolysis, respectively. Pyrolysis has increasingly been receiving attention in recent years as an acceptable route for waste disposal [9]. Sewage sludge pyrolysis produces three fractions: liquid, solid, and gaseous [10]. The gaseous and liquid fractions had a relatively high-energy value and consequently, they could be considered potential fuels. The solid fraction can be used as cheaper carbon-based adsorbents for pollutant removal [10].
Li et al. [7] studied the pyrolysis characteristics and kinetics of municipal sludge by Thermogravimetry Fourier-transform infrared analysis (TG-FTIR). The results indicated that the pyrolysis of municipal sludge with nitrogen as the carrier gas could be divided into three stages including dehydration, degradation of organic matter, and decomposition of inorganic minerals and undecomposed organic matter when the rate of heating was 15°C/min. In addition, CO2, CO, CH4, some aldehydes, and carboxylic acids were the major gas products of pyrolysis. Pokorna et al. [11] evaluated the production of pyrolysis oil from three types of sewage sludges. The maximum oil yield from flash pyrolysis, performed at 500°C, was 43.1%; the water content in bio-oils obtained from secondary sludge was relatively low, i.e. 10.3%. In addition, Othman et al. [8] studied the pyrolysis of sewage sludge in a tubular micro-reactor under various conditions. The yields of gas, oil, and char during pyrolysis were in the range of 6.1–14.5%, 11.1–32.4%, and 53.1–82.7%, respectively. The yield of oil increased with an increase in the temperature and reaction time used for pyrolysis. The char, the final residue after pyrolysis, can be considered as an environmentally-friendly source of carbon for preparation of activated carbon, which it is one of the prominent adsorbents with high efficiency for the uptake of pollutants from gas and liquid phase [12]. If the char was modified to nanocomposite, it would be used as a useful adsorbent even in petrochemical industry [13–14].
Previously, we had extracted lipids from sewage sludge for biodiesel production. The efficiency of lipid extraction was 92.9% [6]. Residual sewage sludge resulting from lipid extraction was subjected to sugar extraction, and more than 90% of the total carbohydrate content was extracted by acid pretreatment, followed by enzymatic saccharification [15]. Finally, we produced bioethanol using the sugars extracted from sewage sludge [15]. However, because the total content of lipid and carbohydrate is less than 25% [6], the residual sewage sludge is still of large volume and needs to be utilized to produce valuable materials and minimize the remanent waste that would be landfilled.
As stated above, most previous studies used raw sewage sludge for bio-oil production. In this study, to achieve the maximum utilization of the sewage sludge, the residual sewage sludge that remained after lipid and sugar extraction was used to produce bio-oil through pyrolysis. That is, this study also aimed to minimize the final waste to be treated. The characteristics of sewage sludge pyrolysis after lipid and sugar extraction were investigated. In addition, bio-oil was produced using a micro-tubing reactor, and the optimal conditions for this reaction were explored. Finally, the composition of bio-oil was investigated, and a kinetic study of this pyrolysis reaction was conducted.
2. Experimental Methods
2.1. Sewage Sludge Preparation and Its Characterization
Sewage sludge was collected from the Gangneung wastewater treatment facility [6]. Previously, we optimized the process of lipid extraction from sewage sludge for biodiesel production [6]. To save on organic solvents, we changed the extraction conditions; lipids were extracted twice from dried sewage sludge by incubating 8 mL/g-sludge with chloroform (99%; Wako, Japan) and methanol (99% purity, Showa, Japan) in a ratio of 1:2 (v/v) for 4 h at 70°C. The sewage sludge obtained after lipid extraction was saccharified to obtain sugars for bioethanol production by a treatment with acid (5.9% (v/v) at 120°C for 85 min), followed by a treatment with 500 μL of an enzymatic solution comprised of Celluclast (Novozyme, Denmark) and Viscozyme (Novozyme, Denmark) in a ratio of 1:2 (v/v) at pH 4.8 and 50°C for 12 h [15]. The remaining sewage sludge after lipid and sugar extraction was dried at 105°C for 24 h and used to obtain bio-oil by pyrolysis in this study. Carbohydrate content was determined by using the phenol-sulfuric acid method [16]. Crude protein content was determined by the Kjeldahl method using the Kjeldahl system (Buchi, Flawil, Switzerland). The moisture content of the sewage sludge was measured according to ASTM E 1756 [17]. The ash content of sewage sludge was measured according to ASTM E 1755 [17]. The C, H, N, and S content of sewage sludge were determined using an elemental analyzer (Flash EA1112, CE Instrument, UK), and the O content was estimated by subtracting the sum of C, H, N, and S content from 100% [17–18].
Thermogravimetric analysis (TGA) of the sewage sludge sample (12.0 ± 1.0 mg) was carried out using TGA equipment (Q50 Instrument, New Castle, USA). Nitrogen was used as the carrier gas at a flow rate of 25 mL/min. The temperature was elevated from 25 to 700°C at heating rates of 5, 10, 15, and 20°C/min. The differential rate of conversion, dX/dt, was determined by differentiating the conversion by time at different temperatures and heating rates.
2.2. Micro-tubing Reactor
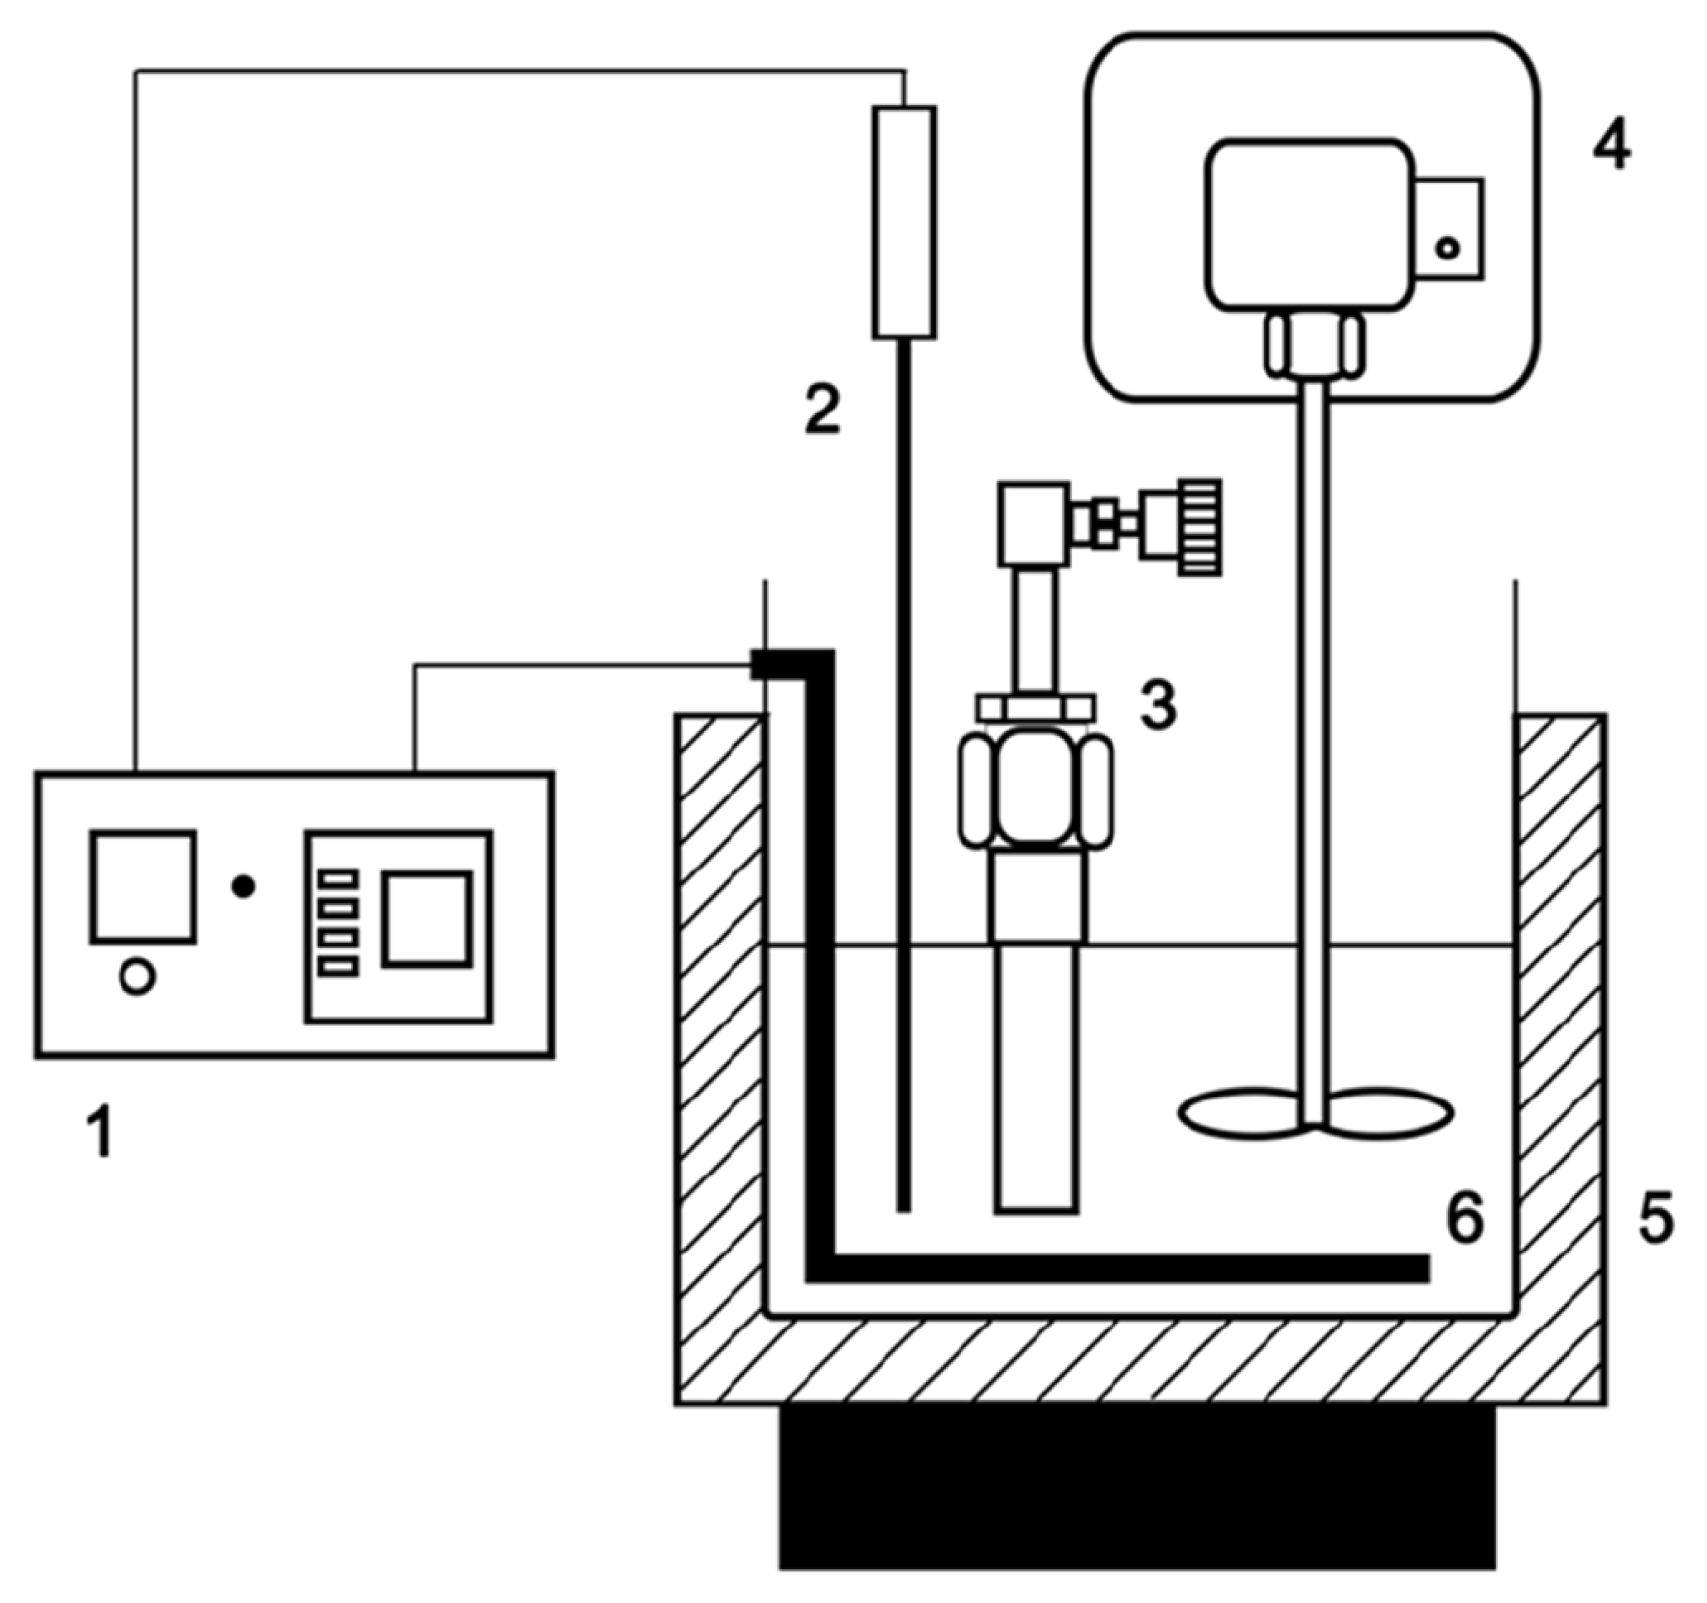
The pyrolysis of the sewage sludge sample was carried out in a micro-tubing reactor that was tightly closed. The body of the apparatus consisted of a stainless-steel reactor that was 110 mm in length and 22 mm in diameter. The pyrolysis system (Fig. 1) consisted of a salt bath, temperature controller, mechanical stirrer, and micro-tubing reactor with an inner volume of approximately [18]. In each experiment, the tubing reactor was loaded with 2.0 g of the sewage sludge sample and placed into a molten salt bath 40 cm3. A molten salt bath, which has excellent heat transfer properties, was prepared with eutectic salt of KNO3 (59%) and Ca(NO3)2 (41%) that had been pre-heated to the desired reaction temperature of 370, 380 or 390 ± 1°C. These pyrolysis temperatures were selected based on data from the differential thermogravimetric analysis (DTG) curve. Various reaction times ranging from 1 to 5 min were tested at each reaction temperature. After the desired reaction time at the giving temperature was reached, the reactor was immediately removed from the molten salt bath and cooled to the ambient temperature using cold water. After cooling for 60 min, the reactor was opened by removing the valve assembly to release the gas, and the oil and char fractions were collected [19]. The pyrolysis product distribution was determined by weighing the gas, oil and char products. The gas yield was obtained by weighing the micro-tubing reactor before and after the release of gas. The mixture of char and bio-oil were separated into bio-oil (acetone-soluble) and char (acetone-insoluble) using a micro filter paper (pore size: 0.45 um), with a vacuum pump after solvent extraction with acetone. After separated, the char were dried in an oven at 90°C for 60 min and cooled to the ambient temperature in exsiccator. After that, the char yield was obtained by weighing the sample before and after reaction. Each experiment was repeated three times, and the average data were used for estimating yields. The product yields were calculated according to the following equations [18].
2.3. Analysis
The analysis of bio-oil composition was performed using GC-MS (7890A, Agilent, USA) with a capillary column of HP-5MS (30 m × 0.25 mm × 0.25 μm). Highly pure helium was used as a carrier gas with a flow rate of 1.0 mL/min. The temperature of the GC injector was kept at 280°C and the injection volume was 1 μL. The GC oven was programmed from an initial temperature of 40°C to 200°C with a heating rate 5°C/min; the temperature was maintained for 5 min, and then increased to 300°C at a heating rate of 10°C/min. This temperature was maintained for a duration of 5 min [18].
2.4. Kinetic Parameter Estimation
Kinetic parameter estimation was carried out through a nonlinear least-squares regression of the experimental data using Sigma Plot (Ver.10, Systat software, Inc, USA). The reaction rate constants k1, k2, and k3 that were obtained for gas, liquid, and solid products at three different reaction temperatures are shown in Table 3.
3. Results and Discussion
3.1. Characterization of Sewage Sludge after Lipid and Sugar Extraction
The composition of raw sewage sludge (RSS), sludge after lipid extraction (SALE), and sludge after lipid and sugar extraction (SALSE) were measured and compared, as presented in Table 1. RSS consisted of 14.5% lipids, 8.9% carbohydrates, 42.8% proteins, 32.1% ash, and 1.7% moisture. After lipid extraction for biodiesel production, the compositions of lipids, carbohydrates, proteins, ash, and moisture were 2.6%, 8.9%, 52.2%, 35.3%, and 1.0%, respectively. Notably, the lipid content was significantly decreased from 14.5% to 2.6% while carbohydrates and proteins were barely extracted. The residual sewage sludge was further utilized for sugar extraction using acid pretreatment, followed by enzyme pretreatment for bioethanol production. After lipid and sugar extraction, the residual sewage sludge mainly contained 56.1% proteins, 2.3% lipids, 1.0% carbohydrates, 38.9% ash, and 1.7% moisture. To achieve the complete utilization of sewage sludge, SALSE was pyrolyzed to obtain valuable bio-oil.
Table 2 shows that the C, H, O, N, and S content of SALSE was 47.8%, 6.5%, 38.7%, 5.6%, and 1.5%, respectively. According to the Demirbas method [18, 20], the higher heating value (HHV) of biomass could be calculated using the following equation [8, 18]:
Here, [C], [H], [O], and [N] represent the concentrations (wt%) of carbon, hydrogen, oxygen, and nitrogen, respectively. The HHV is strongly dependent on the carbon and oxygen content of the feedstock; high carbon and low oxygen content result in an increase in the HHV. The HHV of SALSE was 18.51 MJ kg−1, which was 35.7% and 20.2% higher than those of sewage sludge in studies by Ma et al. [21] (13.64 MJ kg−1) and Calvo et al. [22] (15.4 MJ kg−1), and higher than that of the microalgae sample (12.11 MJ kg−1) [23], indicating its feasibility as a source of energy [24].
3.2. Thermogravimetric Analysis of the Sewage Sludge after Lipid and Sugar Extraction
The TGA of SALSE can be expressed as a function of the conversion factor X, which is defined as follows [23–24]:
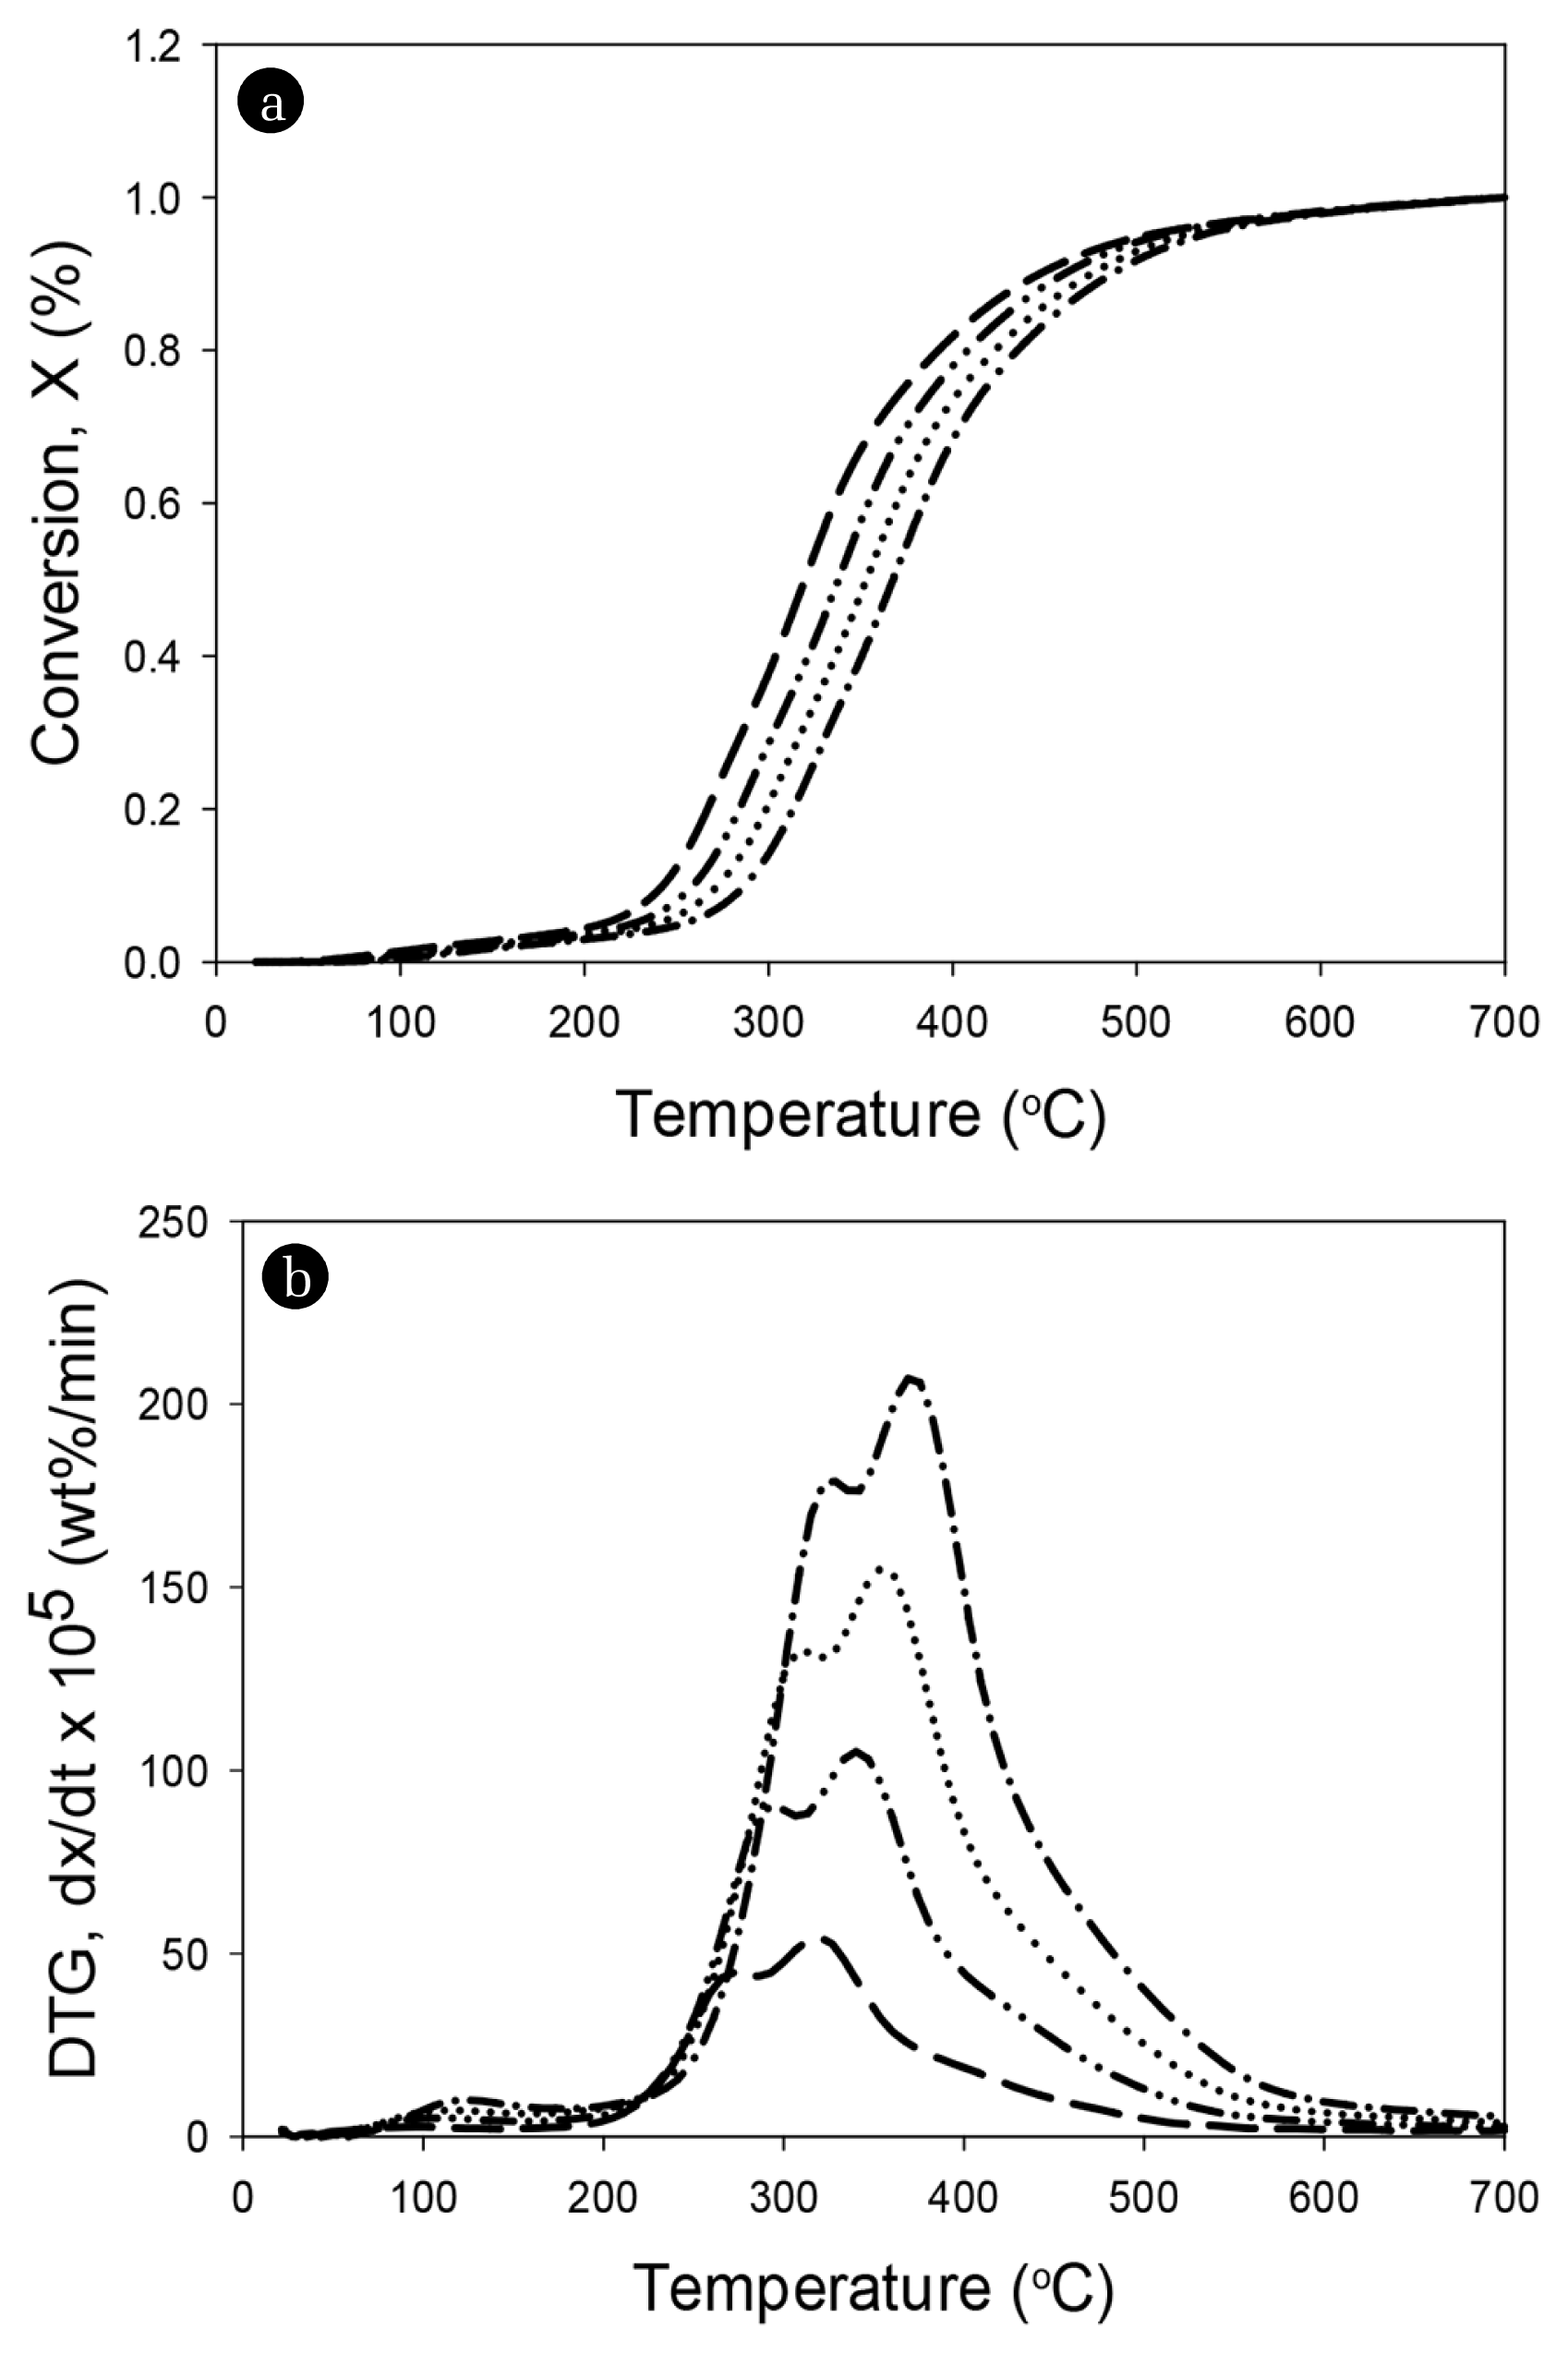
Here, W0 is the initial mass of SALSE, W is the mass of pyrolytic SALSE at time t, and W∞ is the final residual mass after TGA. The degree of conversion versus temperature of the sewage sludge in TGA at different heating rates of 5, 10, 15, and 20°C/min are shown in Fig. 2(a). The formation of a peak at a temperature lower than 200°C could be attributed to the vaporization of moisture attached to the sample surface [8, 25–26]. However, in this study, a few peaks appeared below 200°C because SALSE was well dried, which was consistent with the fact that the moisture content of SALSE was as low as 1.68%. The conversion curves at different heating rates of 5, 10, 15, and 20°C/min showed a similar behavior, and the height of the curves started to increase rapidly in the temperature range of 200 to 400°C. However, the conversion curves were shifted toward the right with an increase in the heating rate, which was because of a higher instantaneous thermal energy introduced into the reaction system at a higher heating rate, resulting in a higher conversion rate [23].
The DTG curves of SALSE at different heating rates are shown in Fig. 2(b). The DTG curve at each heating rate has two peaks between 200 and 550°C (peaks were around 337.0 and 379.3°C), indicating the decomposition of the main components (lipids, carbohydrates, and proteins) in the SALSE [27]. The figure shows that the maximum rate of conversion or decomposition tends to increase with an increase in the heating rate, possibly because a high heating rate provides more energy for heat transfer into the sewage samples [28]. The maximum points of the DTG curves occurred at 284, 301, 317, and 334°C at the heating rates of 5, 10, 15, and 20°C/min, respectively. Previous studies report that the peaks between 200 and 350°C could be attributed to the decomposition of carbohydrates, lipids, and proteins, while those below 200°C could be attributed to the vaporization of water and some very light volatile compounds [25, 27, 29–30].
3.3. Kinetic Parameters for Pyrolysis of Sewage Sludge after Lipid and Sugar Extraction
Studies regarding TGA graphs contribute to the enhancement of knowledge of the kinetics of this thermal process, and therefore, to the establishment of the optimal operational conditions for effective utilization of sewage sludge [31]. The TGA graphs were analyzed to determine the Arrhenius parameters (activation energy and pre-exponential factor) of sewage sludge. The activation energy is the minimum energy required to start a reaction, and a reaction with low activation energy takes place more easily than a reaction with high activation energy [32]. The pre-exponential factor, also known as the frequency factor, indicates the number of collisions between two molecules. The differential method was used to determine the kinetic parameters of pyrolysis from the thermogravimetric data [14, 23–24]. The rate of conversion, dX/dt, during thermal decomposition is expressed as [28],
The temperature-dependent reaction rate constant k is expressed by the Arrhenius equation;
Here, A, Ea, R, and T represent the pre-exponential factor, activation energy, universal gas constant, and temperature, respectively. The temperature-independent conversion function, f(x), is expressed as,
Substituting Eq. (7) and (8) into Eq. (6) and taking the natural logarithm, the above equation yields
Here, A, n, T, and R represent the pre-exponential factor (s−1), reaction order, pyrolysis temperature (K), and gas constant (8.314 J/mol−1K−1), respectively.
The activation energy, E (kJ/mol), based on Eq. (9), can be determined from the slope of -E/R based on a plot of 1/T vs ln(dX/dt). The intercept ln(A.Xn) was obtained from Eq. (9) for each conversion, from 10 to 90%. The pre-exponential factor (A) could be obtained by assuming that the order of reaction (n) is 0, 1, or 2 [17]. Table 2 shows that the activation energies had similar values of 67.0, 71.9, and 81.7 kJ mol−1 at conversions of 10, 20 and 30%, respectively, until a conversion of 40%, where the activation energies increased to 101.7 kJ mol−1. This may be due to the decomposition of carbohydrates [17, 23]. After that, the activation energy decreased slowly with a 40% to 70% increase in the conversions. When the conversions increased from 70% to 90%, the activation energy increased sharply because of protein degradation [1, 17].
The results in this study are similar to those reported by Li et al. [7], where the activation energies and pre-exponential factors of sewage sludge were in the range of 59.6–150.3 kJ mol−1 and 1.6 × 10⁷ – 6.0 × 10¹¹ min−1, respectively. When compared with the activation energy for the pyrolysis of palm fiber (192.7 to 689.0 kJ/mol for the conversion of 10 to 90%), SALSE could be degraded much more easily than palm fiber [24]. Table 2 shows the pre-exponential factors calculated from Eq. (9), assuming the reaction to be of the 0th, 1st or 2nd order. The pre-exponential factors increased with an increase in the heating rate. Most of the decomposition occurred at the conversions from 20% to 80%, where the pre-exponential factors were in the range of 100–105 s−1.
3.4. Pyrolysis of Sewage Sludge in a Micro-tubing Reactor under Various Conditions
The effect of the temperature (370, 380, and 390°C) and reaction time (1 to 5 min) used for pyrolysis on the product yield was investigated. Fig. 3 shows the yield of bio-oil, gas, and char as a function of the pyrolysis conditions for SALSE. The yields of bio-oil and gaseous products were increased with an increase in the reaction temperature and reaction time. The bio-oil yield increased from 8.8 to 30.9% at 370°C from 1 to 5 min and increased to a maximum of 10.1 to 33.3% at 390°C from 1 to 5 min. The gas yield increased from 3.9 to 16.6% at 370°C from 1 to 5 min and increased to a maximum of 2.48 to 17.7% at 390°C from 1 to 5 min. The higher bio-oil yield at higher temperatures is mainly attributed to the enhancement of devolatilization reactions at higher temperatures, because of more energy being available to break the bonds of organic compounds in the sludge [33]. However, the proportion of solids decreased with an increase in the reaction temperature and reaction time. The char yield of SALSE was decreased from 100 to 56.0% at a reaction temperature of 390°C and reaction time of 5 min, while a char yield of 87.3% was obtained at 370°C in 1 min.
3.4.1. Kinetics model for pyrolysis of sewage sludge in the micro-tubing reactor
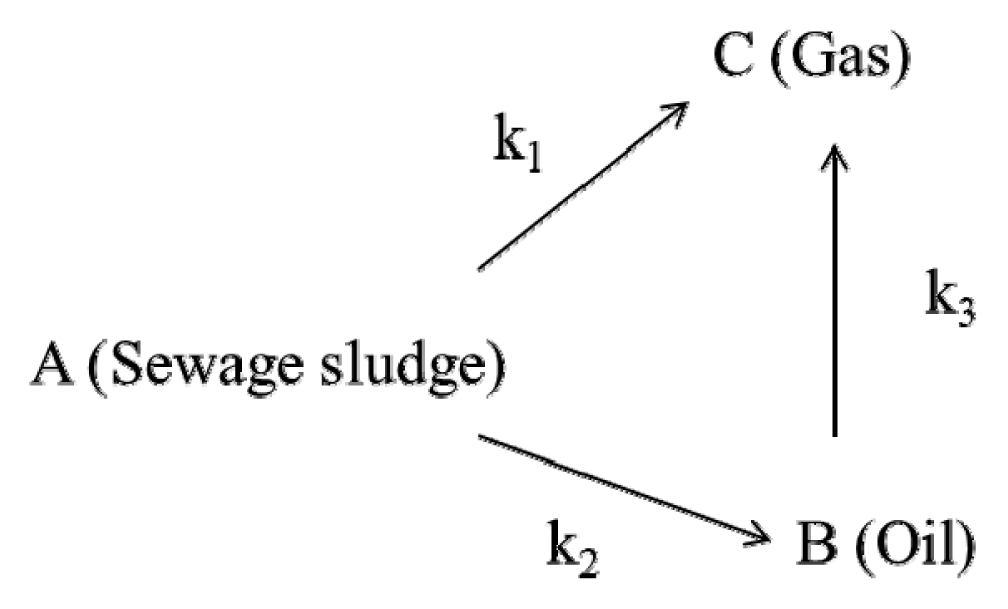
The data from the previous experiment that used a micro-tubing reactor were utilized to investigate the pyrolysis mechanism of SALSE using the three-lump kinetic model [19, 24, 28]. In this model, the pyrolysis mechanism was established with three assumptions; (1) reaction pathway is comprised of series and parallel reactions (2) the reactions are irreversible and first-order (3) sewage sludge is converted directly to gas, or converted to bio-oil and subsequently to gas. Accordingly, the mechanism of the pyrolysis of SALSE can be depicted as follows.
Here, k1, k2, and k3 are the reaction rate constants for conversions of SALSE to gas, SALSE to bio-oil, and bio-oil to gas, respectively. Based on this mechanism, the kinetic equations for the reaction in terms of their yields (CA, CB, and CC) are as follows:
Here, CA, CB, and CC are the yields of char (solid), bio-oil, and gas, respectively. These differential equations are solved to yield Eq. (12) to (14).
Here, CA0 and CB0 are the initial yields of solid (100%) and bio-oil (0%). The reaction rate constants k1, k2, and k3 were obtained for each component product at three different reaction temperatures. The estimated reaction rate constants for the pyrolysis of SALSE are shown in Table 3. The reaction rate constants of k1 and k2 increased from 0.0215 to 0.0318 min−1 and from 0.0990 to 0.1054 min−1, respectively, with an increase in the reaction temperature from 370°C to 390°C, while k3 decreased from 0.0601 to 0.0541 min−1.
The decrease in k3 may be due to the high pressure, caused by the high temperature [17]. As shown in Table 4, the reaction rate constants were in the order of k2 > k3 > k1 (0.0318 min−1) at each experimental temperature. These results indicate that the predominant reaction pathway of the pyrolysis of sludge after lipid and sugar extraction was from sewage sludge to bio-oil and bio-oil to gas, rather than from sewage sludge to gas [19].
3.4.2. Bio-oil composition
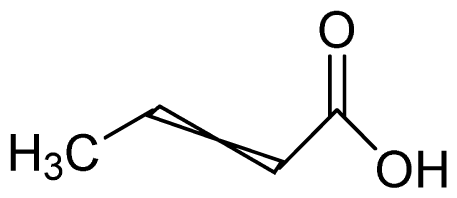
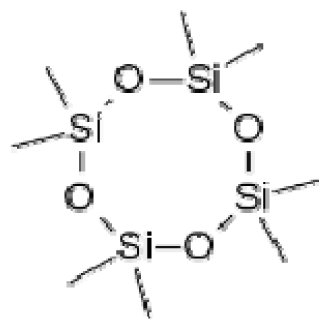
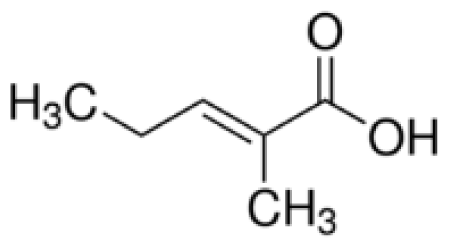
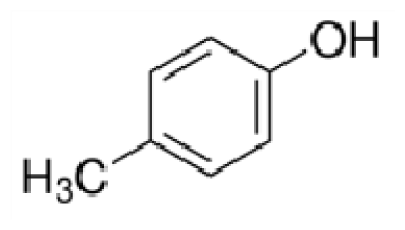
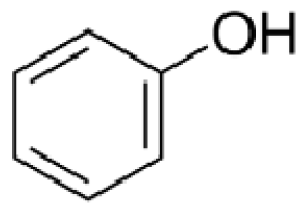
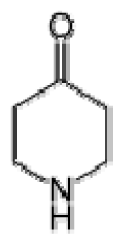
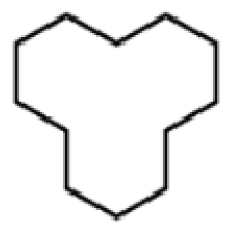
Bio-oil can be used as a source of chemicals as well as fuels [34]. Therefore, it is important to analyze the components of bio-oil. The bio-oil obtained from pyrolysis at the optimal temperature and duration of 390°C and 5 min in a micro-tubing reactor was analyzed by GC-MS, as shown in Table 4. The main components of bio-oil were trans-2-pentenoic acid (28.4%), 2-methyl-2-pentenoic acid (12.3%), tetradecane nitrile (6.5%), and 4-methyl-phenol (5.1%), and these four components accounted for 52.3% of the bio-oil. These results show that oxygenated compounds such as acids, ketones, and phenols are formed by the pyrolysis of lipids and polysaccharides in the sewage sludge. Furthermore, nitrogen compounds such as nitriles and amides are formed by the pyrolysis of the protein and nucleic acid in the sewage sludge derived from dead microorganisms [35–36]. As stated above, the bio-oil composition of sewage sludge in this study was a complex mixture. It could be grouped into the following classes: aliphatic hydrocarbons (tridecane, pentadecane and hexadecane, etc.), aromatics (cyclotetradecane and cyclododecane), phenols (phenol and 4-methyl-phenol), ketones (4-piperidinone), acids (2-butenoic acid and trans-2-pentenoic acid), and nitrogen (tetradecanenitrile) compounds, which were similar to the classes of sewage sludge, described by Ma et al. [21], Arazo et al. [35], and Lin et al. [37]. A high proportion of aliphatic hydrocarbons would be favorable for fuel-related applications [38] because straight chain hydrocarbons have a high heating value and lower viscosity. These are important properties of fuels used in transport and stationary engines [39]. In addition, Fonts et al. [40] reported that a high proportion of aliphatic hydrocarbons would enable the use of pyrolysis liquid as fuels.
4. Conclusions
To achieve the utilization of the entire sewage sludge that remains after lipid and sugar extraction, it was used to produce bio-oil. The lipid and carbohydrate content was decreased significantly from 14.5 to 2.3% and 8.9 to 1.0%, respectively after lipid and sugar extraction. The pyrolysis of sludge in TGA mainly occurred at temperatures lower than 400°C. Therefore, the pyrolysis of sewage sludge after lipid and sugar extraction was carried out in a micro-tubing reactor at 370, 380, and 390°C at different reaction time durations of 1 to 5 min. The maximum bio-oil and gas yields of 33.3% and 17.7% were obtained after pyrolysis at 390°C for 5 min, while the solid yield decreased from 100 to 56.0%. The kinetic rate constants indicated that the predominant reaction pathways for the pyrolysis of SALSE are from sewage sludge to bio-oil, and subsequently to gas, rather than from sewage sludge to gas. The main components of bio-oil were trans-2-pentenoic acid (28.4%), 2-methyl-2-pentenoic acid (12.3%), tetradecane nitrile (6.5%), and 4-methyl-phenol (5.1%).
We tried to produce bio-oil through pyrolysis from sewage sludge remaining after biodiesel and bioethanol production. Therefore, this study would maximize the utilization of solid waste and minimize its remnants in sewage sludge. However, pyrolysis requires a lot of energy and economic feasibility analysis should be performed in the future.


